---
title: Pivotal Application Service (PAS) on AWSをPrometheusでモニタリング
tags: ["AWS", "Cloud Foundry", "Pivotal Cloud Foundry", "Ops Manager", "PAS", "Prometheus", "Grafana", "AlertManager", "BOSH"]
categories: ["Dev", "PaaS", "CloudFoundry", "PCF", "Monitoring"]
date: 2019-03-25T14:16:26Z
updated: 2019-03-27T01:43:53Z
---
[前記事](https://blog.ik.am/entries/477)でインストールした環境に対して、Prometheusでモニタリングするためのセットアップのメモです。
前記事の環境を前提にしています。
PrometheusはOSSの[Prometheus BOSH Release](https://github.com/bosh-prometheus/prometheus-boshrelease)を使用します。
BOSHでPrometheus, Grafana, AlertManagerを管理できるだけでなく、ダッシュボードやAlertルールがバンドルされているので、BOSHやCloud Foundryを使っていてこれを使わない手はないです。
Prometheus、Grafana、AlertManagerへのReverse ProxyとしてNginxもデプロイされます。NginxはPrometheusとAlertManagerへのBasic認証機能も提供します。
このBOSH ReleaseはOpsManagerのGUIをからTile形式でインストールするものではなく、`bosh` CLIでBOSH Directorに対してインストールします。
OSSのBOSH Releaseをデプロイするために別のBOSH Directorを作る場合もありますが、BOSH Directorを複数台管理するアップデートがおろそかになりがちなので、ここではOps ManagerでインストールされたBOSH Directorを使用します。
**目次**
### 新規ネットワークの作成
Ops ManagerがデプロイするBOSH Directorを自由に使う場合には、競合を避けるためにOps Managerで管理されているサブネット(ここでは`infrastructure`,`deployment`,`services`)は使わない方が良いです。
新規にサブネットを作成します。ここでは`bosh`という名前のサブネットをterraformで作成します。またPrometheusで使用するALBとRoute53のDNSレコードも同時に作成します。
下図のピンク色の部分を作成します。

PlantUML(参考)
```
@startuml
package "public" {
package "az1 (10.0.0.0/24)" {
node "Ops Manager"
rectangle "web-lb-1"
rectangle "ssh-lb-1"
rectangle "bosh-lb-1" #pink
boundary "NAT Gateway"
}
package "az2 (10.0.1.0/24)" {
rectangle "web-lb-2"
rectangle "ssh-lb-2"
rectangle "bosh-lb-2" #pink
}
package "az3 (10.0.2.0/24)" {
rectangle "web-lb-3"
rectangle "ssh-lb-3"
rectangle "bosh-lb-3" #pink
}
}
package "infrastructure" {
package "az2 (10.0.16.16/28)" {
}
package "az3 (10.0.16.32/28)" {
}
package "az1 (10.0.16.0/28)" {
}
}
package "deployment" {
package "az1 (10.0.4.0/24)" {
}
package "az2 (10.0.5.0/24)" {
}
package "az3 (10.0.6.0/24)" {
}
}
package "services" {
package "az3 (10.0.10.0/24)" {
}
package "az2 (10.0.9.0/24)" {
}
package "az1 (10.0.8.0/24)" {
}
}
package "bosh" #pink {
package "az3 (10.0.20.0/24)" {
}
package "az2 (10.0.21.0/24)" {
}
package "az1 (10.0.22.0/24)" {
}
}
boundary "Internet Gateway"
actor Operator #green
Operator -[#green]--> [Ops Manager]
public -up-> [Internet Gateway]
infrastructure -> [NAT Gateway]
deployment -up-> [NAT Gateway]
services -up-> [NAT Gateway]
bosh -up-> [NAT Gateway]
@enduml
```
前回使用したTerraformのテンプレートを変更します。
Terraformテンプレートを変更
```
# bosh module作成
mkdir -p template/modules/bosh
# bosh subnetの追加
cat <<'EOF' > template/modules/bosh/subnets.tf
locals {
# cidrsubnet("10.0.0.0/16", 6, 5) => 10.0.20.0/22
bosh_cidr = "${cidrsubnet(var.vpc_cidr, 6, 5)}"
}
resource "aws_subnet" "bosh_subnets" {
count = "${length(var.availability_zones)}"
vpc_id = "${var.vpc_id}"
cidr_block = "${cidrsubnet(local.bosh_cidr, 2, count.index)}"
availability_zone = "${element(var.availability_zones, count.index)}"
tags = "${merge(var.tags, map("Name", "${var.env_name}-bosh-subnet${count.index}"))}"
}
data "template_file" "bosh_subnet_gateways" {
vars {
gateway = "${cidrhost(element(aws_subnet.bosh_subnets.*.cidr_block, count.index), 1)}"
}
# Render the template once for each availability zone
count = "${length(var.availability_zones)}"
template = "$${gateway}"
}
resource "aws_route_table_association" "route_bosh_subnets" {
count = "${length(var.availability_zones)}"
subnet_id = "${element(aws_subnet.bosh_subnets.*.id, count.index)}"
route_table_id = "${element(var.route_table_ids, count.index)}"
}
EOF
# ALBの作成
cat <<'EOF' > template/modules/bosh/lbs.tf
resource "aws_lb" "bosh-lb" {
name = "${var.env_name}-bosh-lb"
subnets = ["${var.public_subnet_ids}"]
security_groups = ["${aws_security_group.bosh-lb.id}"]
}
resource "aws_iam_server_certificate" "bosh-lb" {
name = "${var.env_name}-bosh-lb"
private_key = "${var.ssl_private_key}"
certificate_body = "${var.ssl_cert}"
lifecycle {
ignore_changes = ["id", "certificate_body", "certificate_chain", "private_key"]
}
}
resource "aws_lb_listener" "bosh-lb" {
load_balancer_arn = "${aws_lb.bosh-lb.arn}"
port = "443"
protocol = "HTTPS"
ssl_policy = "ELBSecurityPolicy-2015-05"
certificate_arn = "${aws_iam_server_certificate.bosh-lb.arn}"
default_action {
target_group_arn = "${aws_lb_target_group.prometheus.arn}"
type = "forward"
}
}
resource "aws_lb_target_group" "prometheus" {
name = "${var.env_name}-prometheus"
port = "9090"
protocol = "HTTP"
vpc_id = "${var.vpc_id}"
health_check {
protocol = "HTTP"
path = "/"
port = 9090
matcher = "401"
healthy_threshold = 6
unhealthy_threshold = 3
timeout = 3
interval = 5
}
}
resource "aws_lb_target_group" "grafana" {
name = "${var.env_name}-grafana"
port = "3000"
protocol = "HTTP"
vpc_id = "${var.vpc_id}"
health_check {
protocol = "HTTP"
path = "/"
port = 3000
matcher = "401"
healthy_threshold = 6
unhealthy_threshold = 3
timeout = 3
interval = 5
}
}
resource "aws_lb_target_group" "alertmanager" {
name = "${var.env_name}-alertmanager"
port = "9093"
protocol = "HTTP"
vpc_id = "${var.vpc_id}"
health_check {
protocol = "HTTP"
path = "/"
port = 9093
matcher = "401"
healthy_threshold = 6
unhealthy_threshold = 3
timeout = 3
interval = 5
}
}
resource "aws_lb_listener_rule" "prometheus" {
listener_arn = "${aws_lb_listener.bosh-lb.arn}"
priority = 30
action {
type = "forward"
target_group_arn = "${aws_lb_target_group.prometheus.arn}"
}
condition {
field = "host-header"
values = ["prometheus.sys.${var.env_name}.${var.dns_suffix}"]
}
}
resource "aws_lb_listener_rule" "grafana" {
listener_arn = "${aws_lb_listener.bosh-lb.arn}"
priority = 31
action {
type = "forward"
target_group_arn = "${aws_lb_target_group.grafana.arn}"
}
condition {
field = "host-header"
values = ["grafana.sys.${var.env_name}.${var.dns_suffix}"]
}
}
resource "aws_lb_listener_rule" "alertmanager" {
listener_arn = "${aws_lb_listener.bosh-lb.arn}"
priority = 32
action {
type = "forward"
target_group_arn = "${aws_lb_target_group.alertmanager.arn}"
}
condition {
field = "host-header"
values = ["alertmanager.sys.${var.env_name}.${var.dns_suffix}"]
}
}
resource "aws_security_group" "bosh-lb" {
name = "${var.env_name}-bosh-lb"
vpc_id = "${var.vpc_id}"
}
resource "aws_security_group_rule" "outbound" {
type = "egress"
from_port = 0
to_port = 0
protocol = "-1"
cidr_blocks = ["0.0.0.0/0"]
security_group_id = "${aws_security_group.bosh-lb.id}"
}
resource "aws_security_group_rule" "https" {
type = "ingress"
from_port = "443"
to_port = "443"
protocol = "tcp"
cidr_blocks = ["0.0.0.0/0"]
security_group_id = "${aws_security_group.bosh-lb.id}"
}
EOF
# DNSの作成
cat <<'EOF' > template/modules/bosh/dns.tf
resource "aws_route53_record" "prometheus" {
zone_id = "${var.zone_id}"
name = "prometheus.sys.${var.env_name}.${var.dns_suffix}"
type = "A"
alias {
name = "${aws_lb.bosh-lb.dns_name}"
zone_id = "${aws_lb.bosh-lb.zone_id}"
evaluate_target_health = true
}
}
resource "aws_route53_record" "alertmanager" {
zone_id = "${var.zone_id}"
name = "alertmanager.sys.${var.env_name}.${var.dns_suffix}"
type = "A"
alias {
name = "${aws_lb.bosh-lb.dns_name}"
zone_id = "${aws_lb.bosh-lb.zone_id}"
evaluate_target_health = true
}
}
resource "aws_route53_record" "grafana" {
zone_id = "${var.zone_id}"
name = "grafana.sys.${var.env_name}.${var.dns_suffix}"
type = "A"
alias {
name = "${aws_lb.bosh-lb.dns_name}"
zone_id = "${aws_lb.bosh-lb.zone_id}"
evaluate_target_health = true
}
}
EOF
# variablesの作成
cat <<'EOF' > template/modules/bosh/variables.tf
variable "env_name" {
type = "string"
}
variable "vpc_cidr" {
type = "string"
}
variable "zone_id" {
type = "string"
}
variable "vpc_id" {
type = "string"
}
variable "dns_suffix" {
type = "string"
}
variable "availability_zones" {
type = "list"
}
variable "route_table_ids" {
type = "list"
}
variable "public_subnet_ids" {
type = "list"
}
variable "ssl_cert" {
type = "string"
}
variable "ssl_private_key" {
type = "string"
}
variable "tags" {
type = "map"
}
EOF
# outputsの作成
cat <<'EOF' > template/modules/bosh/outputs.tf
output "bosh_subnet_ids" {
value = ["${aws_subnet.bosh_subnets.*.id}"]
}
output "bosh_subnet_availability_zones" {
value = ["${aws_subnet.bosh_subnets.*.availability_zone}"]
}
output "bosh_subnet_cidrs" {
value = ["${aws_subnet.bosh_subnets.*.cidr_block}"]
}
output "bosh_subnet_gateways" {
value = ["${data.template_file.bosh_subnet_gateways.*.rendered}"]
}
output "prometheus_target_groups" {
value = [
"${aws_lb_target_group.prometheus.name}",
"${aws_lb_target_group.alertmanager.name}",
"${aws_lb_target_group.grafana.name}",
]
}
EOF
# bosh modulesの追加
cat <<'EOF' >> template/terraforming-pas/main.tf
module "bosh" {
source = "../modules/bosh"
env_name = "${var.env_name}"
dns_suffix = "${var.dns_suffix}"
zone_id = "${module.infra.zone_id}"
availability_zones = "${var.availability_zones}"
vpc_cidr = "${var.vpc_cidr}"
vpc_id = "${module.infra.vpc_id}"
route_table_ids = "${module.infra.deployment_route_table_ids}"
public_subnet_ids = "${module.infra.public_subnet_ids}"
ssl_cert = "${var.ssl_cert}"
ssl_private_key = "${var.ssl_private_key}"
tags = "${local.actual_tags}"
}
EOF
# outputの追加
cat <<'EOF' >> template/terraforming-pas/outputs.tf
output "bosh_subnet_ids" {
value = "${module.bosh.bosh_subnet_ids}"
}
output "bosh_subnets" {
value = "${module.bosh.bosh_subnet_ids}"
}
output "bosh_subnet_availability_zones" {
value = "${module.bosh.bosh_subnet_availability_zones}"
}
output "bosh_subnet_cidrs" {
value = "${module.bosh.bosh_subnet_cidrs}"
}
output "bosh_subnet_gateways" {
value = "${module.bosh.bosh_subnet_gateways}"
}
output "prometheus_target_groups" {
value = "${module.bosh.prometheus_target_groups}"
}
EOF
```
`terraform`コマンドを実行してAWSリソースを作成します。
```
terraform init template/terraforming-pas
terraform plan -out plan template/terraforming-pas
terraform apply plan
```
### Cloud Configの作成
作成したsubnetとLBをBOSH Directorに登録するためにCloud Configを作成します。これはOps Manager上でNetworkを定義した作業と実質的には同じで、今回は`bosh` CLIで設定します。
Cloud Configのマニフェストファイルに設定する情報はTerraformのoutputから作成可能です。
cloud-config.ymlの作成
```
export TF_DIR=$(pwd)
export BOSH_NETWORK_NAME=bosh
export BOSH_IAAS_IDENTIFIER_0=$(terraform output -json bosh_subnets | jq -r .value[0])
export BOSH_NETWORK_CIDR_0=$(terraform output -json bosh_subnet_cidrs | jq -r .value[0])
export BOSH_RESERVED_IP_RANGES_0=$(echo $BOSH_NETWORK_CIDR_0 | sed 's|0/24$|0|g')-$(echo $BOSH_NETWORK_CIDR_0 | sed 's|0/24$|4|g')
export BOSH_STATIC_IP_RANGES_0=$(echo $BOSH_NETWORK_CIDR_0 | sed 's|0/24$|200|g')-$(echo $BOSH_NETWORK_CIDR_0 | sed 's|0/24$|250|g')
export BOSH_DNS_0=10.0.0.2
export BOSH_GATEWAY_0=$(terraform output -json bosh_subnet_gateways | jq -r .value[0])
export BOSH_AVAILABILITY_ZONES_0=$(terraform output -json bosh_subnet_availability_zones | jq -r .value[0])
export BOSH_IAAS_IDENTIFIER_1=$(terraform output -json bosh_subnets | jq -r .value[1])
export BOSH_NETWORK_CIDR_1=$(terraform output -json bosh_subnet_cidrs | jq -r .value[1])
export BOSH_RESERVED_IP_RANGES_1=$(echo $BOSH_NETWORK_CIDR_1 | sed 's|0/24$|0|g')-$(echo $BOSH_NETWORK_CIDR_1 | sed 's|0/24$|4|g')
export BOSH_STATIC_IP_RANGES_1=$(echo $BOSH_NETWORK_CIDR_1 | sed 's|0/24$|200|g')-$(echo $BOSH_NETWORK_CIDR_1 | sed 's|0/24$|250|g')
export BOSH_DNS_1=10.0.0.2
export BOSH_GATEWAY_1=$(terraform output -json bosh_subnet_gateways | jq -r .value[1])
export BOSH_AVAILABILITY_ZONES_1=$(terraform output -json bosh_subnet_availability_zones | jq -r .value[1])
export BOSH_IAAS_IDENTIFIER_2=$(terraform output -json bosh_subnets | jq -r .value[2])
export BOSH_NETWORK_CIDR_2=$(terraform output -json bosh_subnet_cidrs | jq -r .value[2])
export BOSH_RESERVED_IP_RANGES_2=$(echo $BOSH_NETWORK_CIDR_2 | sed 's|0/24$|0|g')-$(echo $BOSH_NETWORK_CIDR_2 | sed 's|0/24$|4|g')
export BOSH_DNS_2=10.0.0.2
export BOSH_GATEWAY_2=$(terraform output -json bosh_subnet_gateways | jq -r .value[2])
export BOSH_AVAILABILITY_ZONES_2=$(terraform output -json bosh_subnet_availability_zones | jq -r .value[2])
export BOSH_STATIC_IP_RANGES_2=$(echo $BOSH_NETWORK_CIDR_2 | sed 's|0/24$|200|g')-$(echo $BOSH_NETWORK_CIDR_2 | sed 's|0/24$|250|g')
export PROMETHEUS_TARGET_GROUPS="[$(terraform output prometheus_target_groups | tr -d '\n')]"
cat < cloud-config.yml
networks:
- name: ${BOSH_NETWORK_NAME}
subnets:
- azs:
- ${BOSH_AVAILABILITY_ZONES_0}
cloud_properties:
subnet: ${BOSH_IAAS_IDENTIFIER_0}
dns:
- ${BOSH_DNS_0}
gateway: ${BOSH_GATEWAY_0}
range: ${BOSH_NETWORK_CIDR_0}
reserved:
- ${BOSH_RESERVED_IP_RANGES_0}
static:
- ${BOSH_STATIC_IP_RANGES_0}
- azs:
- ${BOSH_AVAILABILITY_ZONES_1}
cloud_properties:
subnet: ${BOSH_IAAS_IDENTIFIER_1}
dns:
- ${BOSH_DNS_1}
gateway: ${BOSH_GATEWAY_1}
range: ${BOSH_NETWORK_CIDR_1}
reserved:
- ${BOSH_RESERVED_IP_RANGES_1}
static:
- ${BOSH_STATIC_IP_RANGES_1}
- azs:
- ${BOSH_AVAILABILITY_ZONES_2}
cloud_properties:
subnet: ${BOSH_IAAS_IDENTIFIER_2}
dns:
- ${BOSH_DNS_2}
gateway: ${BOSH_GATEWAY_2}
range: ${BOSH_NETWORK_CIDR_2}
reserved:
- ${BOSH_RESERVED_IP_RANGES_2}
static:
- ${BOSH_STATIC_IP_RANGES_2}
type: manual
vm_extensions:
- name: prometheus-alb
cloud_properties:
lb_target_groups: ${PROMETHEUS_TARGET_GROUPS}
EOF
```
`bosh` CLIはOps Manager上で実行するので、この`cloud-config.yml`はSCPでOps Manager上にコピーします。
```
scp -i opsman.pem -o "StrictHostKeyChecking=no" cloud-config.yml ubuntu@${OM_TARGET}:~/
```
Ops ManagerにSSHでログインしてください。
```
./ssh-opsman.sh
```
今後作成するファイルはOps Manager上の`bosh-manifests`ディレクトリで管理します。
```
mkdir -p bosh-manifests
mv cloud-config.yml bosh-manifests
cd bosh-manifests
```
`bosh update-config`コマンドで作成したCloud Configに対して`bosh`という名前をつけて適用します。
```
bosh update-config --type=cloud --name=bosh cloud-config.yml
```
設定済みのconfigは`bosh configs`コマンドで確認できます。この結果にはCloud Config以外にもRuntime Config、CPI Configが含まれます。
```
bosh configs
```
出力結果
```
Using environment '10.0.16.5' as client 'ops_manager'
ID Type Name Team Created At
3 cloud default - 2019-03-24 15:10:12 UTC
6 cloud bosh - 2019-03-24 18:43:07 UTC
4 cpi default - 2019-03-24 15:10:19 UTC
5 runtime cf-013bf999f314121d05fc-bosh-dns-aliases - 2019-03-24 15:10:45 UTC
2 runtime director_runtime - 2019-03-24 15:10:11 UTC
1 runtime ops_manager_dns_runtime - 2019-03-24 15:10:07 UTC
6 configs
```
`default`という名前のCloud ConfigはOps Managerが使用するものです。
### UAA Clientの作成
Prometheus BOSH Releaseでは次の3つのExporterをデプロイします
* BOSH Exporter ... BOSH Directorにアクセスして、BOSH管理下のVM, processのメトリクスを返す
* CF Exporter ... Cloud Controllerにアクセスして、CF管理下のアプリケーションのメトリクスを返す
* Firehose Exporter ... Loggregator(Traffic Controller)にアクセスして、CF管理下のコンポーネントのメトリクスを返す
これらのExporterがBOSH Director、Cloud Controller、Traffic ControllerにアクセスするにはUAAに認可される必要があります。
そのため、各ExporterがUAA ClientとしてUAAに登録されている必要があります。
ここでBOSH ExporterはBOSH DirectorのUAA Client、CF ExporterとFirehose ExporterはPASのUAA Clientであることに注意してください。
各ExporterとUAAの関係は次の通りです。

PlantUML(参考)
```
@startuml
package "public" {
package "az1 (10.0.0.0/24)" {
node "Ops Manager" {
actor Operator
}
}
}
package "infrastructure" {
package "az1 (10.0.16.0/28)" {
node "BOSH Director" {
(director)
(uaa)
(credhub)
}
}
}
package "deployment" {
package "az1 (10.0.4.0/24)" {
node "Cloud Controller"
node "Loggregator Trafficcontroller"
node "UAA"
}
}
package "bosh" {
package "az2 (10.0.21.0/24)" {
node "Prometheus2" {
(prometheus2)
(bosh exporter)
(cf exporter)
}
node "Firehose Exporter"
}
}
[Firehose Exporter] -up-> [Loggregator Trafficcontroller] #blue
[cf exporter] -up-> [Cloud Controller] #green
[bosh exporter] -down-> [director] #red
[director] .> [uaa] #red
[credhub] .up.> [uaa]
[Cloud Controller] .up.> [UAA] #green
[Loggregator Trafficcontroller] .up.> [UAA] #blue
[prometheus2] .> [Firehose Exporter] : scrape
[prometheus2] .> [cf exporter] : scrape
[prometheus2] .> [bosh exporter] : scrape
Operator .> [UAA] :uaac
Operator .> [credhub] :credhub
Operator .> [uaa] :uaac
@enduml
```
まずはUAAのアクセストークンを取得するスクリプトを作成します。
OpsManagerにsshでログインした状態で次のコマンドを実行し、`uaac-token-client-get-p-bosh.sh`を作成してください。
こちらはBOSH DirectorのUAAに対してClientを作成する権限のあるアクセストークンを取得するスクリプトです。
```sh
cd ~/bosh-manifests
cat <<'EOF' > uaac-token-client-get-p-bosh.sh
#!/bin/bash
uaac target ${BOSH_ENVIRONMENT}:8443 --ca-cert ${BOSH_CA_CERT}
uaac token client get ${BOSH_CLIENT} -s ${BOSH_CLIENT_SECRET}
EOF
chmod +x uaac-token-client-get-p-bosh.sh
```
また、次のコマンドを実行し、`uaac-token-client-get-pas.sh`を作成してください。
こちらはPASのUAAに対してClientを作成する権限のあるアクセストークンを取得するスクリプトです。
```sh
cat <<'EOF' > uaac-token-client-get-pas.sh
#!/bin/bash
read -p "opsman username: " opsman_username
read -s -p "opsman password: " opsman_password
echo
access_token=$(curl -k -s -u opsman: https://localhost:443/uaa/oauth/token \
-d username=${opsman_username} \
-d password=${opsman_password} \
-d grant_type=password | jq -r .access_token)
product_guid=$(curl -H "Authorization: Bearer $access_token" -s -k https://localhost:443/api/v0/deployed/products | jq -r '.[] | select(.type == "cf").guid')
client_secret=$(curl -H "Authorization: Bearer $access_token" -s -k https://localhost:443/api/v0/deployed/products/${product_guid}/credentials/.uaa.admin_client_credentials | jq -r .credential.value.password)
system_domain=$(curl -H "Authorization: Bearer $access_token" -s -k https://localhost:443/api/v0/staged/products/${product_guid}/properties | jq -r '.properties.".cloud_controller.system_domain".value')
uaac target uaa.${system_domain}:443 --skip-ssl-validation
uaac token client get admin -s ${client_secret}
EOF
chmod +x uaac-token-client-get-pas.sh
```
#### BOSH Exporter用のUAA Client作成
まずはBOSH Exporeter用のUAA Clientを作成します。
次のコマンドを実行して、`uaac-create-client-bosh-exporter.sh`というスクリプトを作成してください。
```sh
cat <<'EOF' > uaac-create-client-bosh-exporter.sh
#!/bin/bash
# use ${BOSH_CLIENT_SECRET} for convenience
uaac client add bosh_exporter \
--scope uaa.none \
--authorized_grant_types client_credentials,refresh_token \
--authorities bosh.read \
-s ${BOSH_CLIENT_SECRET}
EOF
chmod +x uaac-create-client-bosh-exporter.sh
```
BOSH DirectorのUAAからアクセストークンを取得してください。
```
./uaac-token-client-get-p-bosh.sh
```
出力結果
```
Unknown key: Max-Age = 86400
Target: https://10.0.16.5:8443
Unknown key: Max-Age = 86400
Successfully fetched token via client credentials grant.
Target: https://10.0.16.5:8443
Context: ops_manager, from client ops_manager
```
`uaac-create-client-bosh-exporter.sh`を実行してUAA Clientを作成してください。
```
./uaac-create-client-bosh-exporter.sh
```
出力結果
```
scope: uaa.none
client_id: bosh_exporter
resource_ids: none
authorized_grant_types: refresh_token client_credentials
autoapprove:
authorities: bosh.read
name: bosh_exporter
required_user_groups:
lastmodified: 1553481456657
id: bosh_exporter
```
#### CF Exporter及びFirehose Exporter用のUAA Client作成
次にCF Exporter及びFirehose Exporter用のUAA Clientを作成します。
次のコマンドを実行して、`uaac-create-client-cf-exporter.sh`というスクリプトを作成してください。
```sh
cat <<'EOF' > uaac-create-client-cf-exporter.sh
#!/bin/bash
# use ${BOSH_CLIENT_SECRET} for convenience
uaac client add cf_exporter \
--scope uaa.none \
--authorized_grant_types client_credentials,refresh_token \
--authorities cloud_controller.admin_read_only \
-s ${BOSH_CLIENT_SECRET}
EOF
chmod +x uaac-create-client-cf-exporter.sh
```
次のコマンドを実行して、`uaac-create-client-firehose-exporter.sh`というスクリプトを作成してください。
```sh
cat <<'EOF' > uaac-create-client-firehose-exporter.sh
#!/bin/bash
# use ${BOSH_CLIENT_SECRET} for convenience
uaac client add firehose_exporter \
--scope uaa.none \
--authorized_grant_types client_credentials,refresh_token \
--authorities doppler.firehose \
-s ${BOSH_CLIENT_SECRET}
EOF
chmod +x uaac-create-client-firehose-exporter.sh
```
PASのUAAからアクセストークンを取得してください。
```
./uaac-token-client-get-pas.sh
```
出力結果
```
opsman username: admin
opsman password: ***********
Unknown key: Max-Age = 86400
Target: https://uaa.sys.pas.bosh.tokyo
Unknown key: Max-Age = 86400
Successfully fetched token via client credentials grant.
Target: https://uaa.sys.pas.bosh.tokyo
Context: admin, from client admin
```
`uaac-create-client-cf-exporter.sh`を実行してUAA Clientを作成してください。
```
./uaac-create-client-cf-exporter.sh
```
出力結果
```
scope: uaa.none
client_id: cf_exporter
resource_ids: none
authorized_grant_types: refresh_token client_credentials
autoapprove:
authorities: cloud_controller.admin_read_only
name: cf_exporter
required_user_groups:
lastmodified: 1553484431000
id: cf_exporter
```
`uaac-create-client-firehose-exporter.sh`を実行してUAA Clientを作成してください。
```
./uaac-create-client-firehose-exporter.sh
```
出力結果
```
scope: uaa.none
client_id: firehose_exporter
resource_ids: none
authorized_grant_types: refresh_token client_credentials
autoapprove:
authorities: doppler.firehose
name: firehose_exporter
required_user_groups:
lastmodified: 1553484432000
id: firehose_exporter
```
### Prometheusのデプロイ
準備ができたので、いよいよPrometheusをデプロイします。
管理しやすいように`bosh-manifests`を`git init`して、[Prometheus BOSH Relase](https://github.com/bosh-prometheus/prometheus-boshrelease.git)のリポジトリを`git submodule`で管理します。
この記事では`v24.1.0`タグを使用します。
```
cd ~/bosh-manifests
git init
git submodule add https://github.com/bosh-prometheus/prometheus-boshrelease.git
cd prometheus-boshrelease
git checkout v24.1.0
cd ..
```
`prometheus-boshrelease/manifests`以下にPrometheusをデプロイするためにmanifestファイルと、
カスタマイズするためのops-filesが用意されています。
次のops-filesを使います。
* `manifests/operators/monitor-bosh.yml` ... BOSH Exporterを追加してBOSH管理下のVMをモニタリングする。Dashboard及びAlertも追加する。
* `manifests/operators/enable-bosh-uaa.yml` ... BOSH Directorへの認可にUAAを使用する
* `manifests/operators/monitor-cf.yml` ... CF Exporter及びFirehose Exporterを追加してCloud Foundryをモニタリングする。Dashboard及びAlertも追加する。
* `manifests/operators/monitor-node.yml` ... Node Exporter(後述)用のDashboardを追加する。
* `manifests/operators/use-sqlite3.yml` ... GrafanaのデーターベースとしてPostgreSQL(別VM)ではなく、SQLite3を使用する
* `manifests/operators/enable-cf-api-v3.yml` ... CF ExporterがClooud Controller V3 APIを使用する。
* `manifests/operators/nginx-vm-extension.yml` ... NginxにLoad Balancerをアタッチするための`vm_extension`を指定する。
次のコマンドを実行して、Prometheusをデプロイする`deploy-prometheus.sh`を作成します。
deploy-prometheus.shの作成
```
cat <<'EOF' > deploy-prometheus.sh
#!/bin/bash
read -p "opsman username: " opsman_username
read -s -p "opsman password: " opsman_password
echo
access_token=$(curl -k -s -u opsman: https://localhost:443/uaa/oauth/token \
-d username=${opsman_username} \
-d password=${opsman_password} \
-d grant_type=password | jq -r .access_token)
product_guid=$(curl -H "Authorization: Bearer $access_token" -s -k https://localhost:443/api/v0/deployed/products | jq -r '.[] | select(.type == "cf").guid')
client_secret=$(curl -H "Authorization: Bearer $access_token" -s -k https://localhost:443/api/v0/deployed/products/${product_guid}/credentials/.uaa.admin_client_credentials | jq -r .credential.value.password)
system_domain=$(curl -H "Authorization: Bearer $access_token" -s -k https://localhost:443/api/v0/staged/products/${product_guid}/properties | jq -r '.properties.".cloud_controller.system_domain".value')
bosh deploy -d prometheus prometheus-boshrelease/manifests/prometheus.yml \
-o prometheus-boshrelease/manifests/operators/monitor-bosh.yml \
-o prometheus-boshrelease/manifests/operators/enable-bosh-uaa.yml \
-o prometheus-boshrelease/manifests/operators/monitor-cf.yml \
-o prometheus-boshrelease/manifests/operators/monitor-node.yml \
-o prometheus-boshrelease/manifests/operators/use-sqlite3.yml \
-o prometheus-boshrelease/manifests/operators/nginx-vm-extension.yml \
-v metrics_environment=p-bosh \
-v bosh_url=${BOSH_ENVIRONMENT} \
--var-file bosh_ca_cert=${BOSH_CA_CERT} \
-v uaa_bosh_exporter_client_secret=${BOSH_CLIENT_SECRET} \
-v metron_deployment_name=$(bosh deployments | grep -e '^cf' | awk '{print $1}') \
-v system_domain=${system_domain} \
-v uaa_clients_cf_exporter_secret=${BOSH_CLIENT_SECRET} \
-v uaa_clients_firehose_exporter_secret=${BOSH_CLIENT_SECRET} \
-v traffic_controller_external_port=443 \
-v skip_ssl_verify=true \
-v nginx_vm_extension=prometheus-alb \
-o <(cat <
> Prometheus BOSH Releaseは冗長化に対応していないので、PASとは異なるAZ(ここでは`ap-northeast-1c`)にデプロイして、PASとPrometheusが同時に利用できなくなることを防ぎます。
```
./deploy-prometheus.sh
```
出力結果
```
Continue? [yN]: y
Task 75
Task 75 | 05:00:21 | Preparing deployment: Preparing deployment (00:00:04)
Task 75 | 05:00:28 | Preparing package compilation: Finding packages to compile (00:00:00)
Task 75 | 05:00:28 | Compiling packages: firehose_exporter/862bcd6471097c9af72aefa9592e072d6d6719eb
Task 75 | 05:00:28 | Compiling packages: nginx_prometheus/ef74d5591e198a64b04946a0c3b642626186cac8
Task 75 | 05:00:28 | Compiling packages: grafana_plugins/0ddcc6bca2243679671f469169ef539c2a85a370
Task 75 | 05:00:28 | Compiling packages: grafana_jq/1063cddc54797c233f9a2d3535a0a9a271e6221f (00:01:13)
Task 75 | 05:01:41 | Compiling packages: grafana/fea43efaf55718ace7894e74f115d591cc224788
Task 75 | 05:01:41 | Compiling packages: grafana_plugins/0ddcc6bca2243679671f469169ef539c2a85a370 (00:01:13)
Task 75 | 05:01:41 | Compiling packages: cf_exporter/b9743b8ed0a646a96cd8511e4abcc782fb34b455
Task 75 | 05:01:42 | Compiling packages: firehose_exporter/862bcd6471097c9af72aefa9592e072d6d6719eb (00:01:14)
Task 75 | 05:01:42 | Compiling packages: bosh_exporter/18654351e24e9d39bf831858c2ea4707e1fd7ef8
Task 75 | 05:01:50 | Compiling packages: cf_exporter/b9743b8ed0a646a96cd8511e4abcc782fb34b455 (00:00:09)
Task 75 | 05:01:50 | Compiling packages: prometheus2/cc4982f10c6e7f15a23a9437f09bce511450909f
Task 75 | 05:01:51 | Compiling packages: bosh_exporter/18654351e24e9d39bf831858c2ea4707e1fd7ef8 (00:00:09)
Task 75 | 05:01:51 | Compiling packages: alertmanager/47a08cf1f2c75b00e1a4d58c224599b973103e6a (00:00:09)
Task 75 | 05:02:03 | Compiling packages: prometheus2/cc4982f10c6e7f15a23a9437f09bce511450909f (00:00:13)
Task 75 | 05:02:14 | Compiling packages: nginx_prometheus/ef74d5591e198a64b04946a0c3b642626186cac8 (00:01:46)
Task 75 | 05:04:26 | Compiling packages: grafana/fea43efaf55718ace7894e74f115d591cc224788 (00:02:45)
Task 75 | 05:05:06 | Creating missing vms: grafana/9e8867f7-686d-414c-8814-b0963f41fd91 (0)
Task 75 | 05:05:06 | Creating missing vms: alertmanager/ef31bab1-e6ba-4196-86de-1c265a7d18ed (0)
Task 75 | 05:05:06 | Creating missing vms: nginx/e834eeb3-6fba-413b-a5c0-24cf9d070f27 (0)
Task 75 | 05:05:06 | Creating missing vms: firehose/dafb1c09-97ef-46de-9fac-95b2b7ad0601 (0)
Task 75 | 05:05:06 | Creating missing vms: prometheus2/6ddd5e0f-e97d-4b9b-b6b8-a138ccb55d4b (0)
Task 75 | 05:06:18 | Creating missing vms: alertmanager/ef31bab1-e6ba-4196-86de-1c265a7d18ed (0) (00:01:12)
Task 75 | 05:06:26 | Creating missing vms: grafana/9e8867f7-686d-414c-8814-b0963f41fd91 (0) (00:01:20)
Task 75 | 05:06:26 | Creating missing vms: firehose/dafb1c09-97ef-46de-9fac-95b2b7ad0601 (0) (00:01:20)
Task 75 | 05:06:28 | Creating missing vms: nginx/e834eeb3-6fba-413b-a5c0-24cf9d070f27 (0) (00:01:22)
Task 75 | 05:06:55 | Creating missing vms: prometheus2/6ddd5e0f-e97d-4b9b-b6b8-a138ccb55d4b (0) (00:01:49)
Task 75 | 05:06:55 | Updating instance nginx: nginx/e834eeb3-6fba-413b-a5c0-24cf9d070f27 (0) (canary)
Task 75 | 05:06:55 | Updating instance alertmanager: alertmanager/ef31bab1-e6ba-4196-86de-1c265a7d18ed (0) (canary)
Task 75 | 05:06:55 | Updating instance grafana: grafana/9e8867f7-686d-414c-8814-b0963f41fd91 (0) (canary)
Task 75 | 05:06:55 | Updating instance prometheus2: prometheus2/6ddd5e0f-e97d-4b9b-b6b8-a138ccb55d4b (0) (canary)
Task 75 | 05:06:55 | Updating instance firehose: firehose/dafb1c09-97ef-46de-9fac-95b2b7ad0601 (0) (canary) (00:00:12)
Task 75 | 05:07:08 | Updating instance nginx: nginx/e834eeb3-6fba-413b-a5c0-24cf9d070f27 (0) (canary) (00:00:13)
Task 75 | 05:07:44 | Updating instance alertmanager: alertmanager/ef31bab1-e6ba-4196-86de-1c265a7d18ed (0) (canary) (00:00:49)
Task 75 | 05:07:48 | Updating instance grafana: grafana/9e8867f7-686d-414c-8814-b0963f41fd91 (0) (canary) (00:00:53)
Task 75 | 05:08:11 | Updating instance prometheus2: prometheus2/6ddd5e0f-e97d-4b9b-b6b8-a138ccb55d4b (0) (canary) (00:01:16)
Task 75 Started Mon Mar 25 05:00:21 UTC 2019
Task 75 Finished Mon Mar 25 05:08:11 UTC 2019
Task 75 Duration 00:07:50
Task 75 done
Succeeded
```
> Prometheus BOSH Relaseで新しいバージョン、例えば`v25.0.0`がリリースされたら、次の手順で更新してください。
>
> ```
> cd ~/bosh-manifests/prometheus-boshrelease
> git fetch origin
> git checkout v25.0.0
> cd ..
> ./deploy-prometheus.sh
> ```
次のコマンドを実行して、BOSHが管理しているVM一覧を確認してください。
```
bosh vms
```
出力結果
```
Using environment '10.0.16.5' as client 'ops_manager'
Task 118
Task 119
Task 118 done
Task 119 done
Deployment 'cf-013bf999f314121d05fc'
Instance Process State AZ IPs VM CID VM Type Active
clock_global/29b2abe0-b6aa-4f6d-975f-22fd828fa699 running ap-northeast-1a 10.0.4.12 i-09bd71be81d273774 t2.medium true
cloud_controller/0780e116-554b-4159-a30c-bf19f26a4481 running ap-northeast-1a 10.0.4.10 i-0dc73ef4cd7e70cfb t2.medium true
cloud_controller_worker/15603b1a-1b0a-4edf-9240-8d06087121be running ap-northeast-1a 10.0.4.13 i-028566ae524c2cd5c t2.micro true
credhub/f516b3f6-44e3-476e-bc9e-d062c7be2279 running ap-northeast-1a 10.0.4.20 i-08d7a63eaba917254 m4.large true
diego_brain/9f15438e-3312-4754-85e1-c5e58b398fe2 running ap-northeast-1a 10.0.4.14 i-03e665bfeaf2f30a4 t2.micro true
diego_cell/65728f05-d3ea-4782-aba7-b6cd070820c4 running ap-northeast-1a 10.0.4.15 i-087f2b2e9347f2487 r4.xlarge true
diego_database/01457cd8-f05a-4eed-88db-bd64058f473e running ap-northeast-1a 10.0.4.8 i-081dde85a8e20c9f3 t2.micro true
doppler/c4b413c7-d6f8-4d0d-81af-ac0ff8495785 running ap-northeast-1a 10.0.4.19 i-013fd406f9ad8807f t2.medium true
loggregator_trafficcontroller/36f52a7e-1240-4506-b6da-038442c9ff97 running ap-northeast-1a 10.0.4.16 i-063ef7d7381e64290 t2.micro true
mysql/72bb8162-44cd-4c96-92c0-b44410a4e3b6 running ap-northeast-1a 10.0.4.7 i-000689bb28df9a112 m4.large true
mysql_proxy/77261bd3-dda7-4813-9928-fa30054c01a4 running ap-northeast-1a 10.0.4.6 i-066ff7b03150440e1 t2.micro true
nats/6b4cb4e8-f81c-4f03-aa3f-9bba4d82496a running ap-northeast-1a 10.0.4.5 i-087ff327ee56eeb57 t2.micro true
router/4e54efdd-0387-473b-bc97-1200be6a6659 running ap-northeast-1a 10.0.4.11 i-03199618ff2d5bd12 t2.micro true
syslog_adapter/870032c8-7c4a-49fa-923a-61519e5a93fa running ap-northeast-1a 10.0.4.17 i-0a035fc92e7458ea5 t2.micro true
syslog_scheduler/416f7792-7c89-4b09-b2c8-677cabcfd3a1 running ap-northeast-1a 10.0.4.18 i-0ce495fb2370f69c2 t2.micro true
uaa/c898e032-0e23-444f-9e93-ed3a8c2c9542 running ap-northeast-1a 10.0.4.9 i-0cca8daa56f06e04e t2.medium true
16 vms
Deployment 'prometheus'
Instance Process State AZ IPs VM CID VM Type Active
alertmanager/ef31bab1-e6ba-4196-86de-1c265a7d18ed running ap-northeast-1c 10.0.21.5 i-07a997f6b646aab17 t2.micro true
firehose/dafb1c09-97ef-46de-9fac-95b2b7ad0601 running ap-northeast-1c 10.0.21.9 i-0d76fbd0ccc718bfb t2.micro true
grafana/9e8867f7-686d-414c-8814-b0963f41fd91 running ap-northeast-1c 10.0.21.7 i-09d6c2a41bb8c365e t2.micro true
nginx/e834eeb3-6fba-413b-a5c0-24cf9d070f27 running ap-northeast-1c 10.0.21.8 i-07c40cd12af29d81a t2.micro true
prometheus2/6ddd5e0f-e97d-4b9b-b6b8-a138ccb55d4b running ap-northeast-1c 10.0.21.6 i-05e9907916cd8015f t2.small true
5 vms
Succeeded
```
ここまでのコンポーネント図は次の通りです。

PlantUML(参考)
```
@startuml
package "public" {
package "az1 (10.0.0.0/24)" {
node "Ops Manager"
rectangle "web-lb-1"
rectangle "ssh-lb-1"
rectangle "bosh-lb-1"
boundary "NAT Gateway"
}
package "az2 (10.0.1.0/24)" {
rectangle "web-lb-2"
rectangle "ssh-lb-2"
rectangle "bosh-lb-2"
}
package "az3 (10.0.2.0/24)" {
rectangle "web-lb-3"
rectangle "ssh-lb-3"
rectangle "bosh-lb-3"
}
}
package "infrastructure" {
package "az1 (10.0.16.0/28)" {
node "BOSH Director"
}
}
package "deployment" {
package "az1 (10.0.4.0/24)" {
node "NATS"
node "Router"
database "File Storage"
package "MySQL" {
node "MySQL Proxy"
database "MySQL Server"
}
package "CAPI" {
node "Cloud Controller"
node "Clock Global"
node "Cloud Controller Worker"
}
package "Diego" {
node "Diego Brain"
node "DiegoCell" {
(app3)
(app2)
(app1)
}
node "Diego BBS"
}
package "Loggregator" {
node "Loggregator Trafficcontroller"
node "Syslog Adapter"
node "Syslog Scheduler"
node "Doppler Server"
}
node "UAA"
node "CredHub"
}
}
package "bosh" {
package "az1 (10.0.20.0/24)" {
}
package "az2 (10.0.21.0/24)" {
node "Nginx"
node "Prometheus2" {
(prometheus2)
(bosh exporter)
(cf exporter)
}
node "AlertManager"
node "Grafana"
node "Firehose Exporter"
}
package "az3 (10.0.22.0/24)" {
}
}
boundary "Internet Gateway"
actor User #red
actor Developer #blue
actor Operator #green
User -[#red]--> [web-lb-1]
User -[#red]--> [web-lb-2]
User -[#red]--> [web-lb-3]
Developer -[#blue]--> [web-lb-1] : "cf push"
Developer -[#blue]--> [web-lb-2]
Developer -[#blue]--> [web-lb-3]
Developer -[#magenta]--> [ssh-lb-1] : "cf ssh"
Developer -[#magenta]--> [ssh-lb-2]
Developer -[#magenta]--> [ssh-lb-3]
Operator -[#green]--> [Ops Manager]
Operator -[#green]--> [bosh-lb-1]
Operator -[#green]--> [bosh-lb-2]
Operator -[#green]--> [bosh-lb-3]
public -up-> [Internet Gateway]
infrastructure -> [NAT Gateway]
deployment -> [NAT Gateway]
[Ops Manager] .> [BOSH Director] :bosh
[web-lb-1] -[#red]-> Router
[web-lb-1] -[#blue]-> Router
[web-lb-2] -[#red]-> Router
[web-lb-2] -[#blue]-> Router
[web-lb-3] -[#red]-> Router
[web-lb-3] -[#blue]-> Router
[ssh-lb-1] -[#magenta]-> [Diego Brain]
[ssh-lb-2] -[#magenta]-> [Diego Brain]
[ssh-lb-3] -[#magenta]-> [Diego Brain]
[bosh-lb-1] -[#green]-> [Nginx]
[bosh-lb-2] -[#green]-> [Nginx]
[bosh-lb-3] -[#green]-> [Nginx]
Router -[#red]-> app1
Router -[#blue]-> [Cloud Controller]
Router -[#blue]-> [UAA]
[Doppler Server] --> [Loggregator Trafficcontroller]
[Loggregator Trafficcontroller] -right-> [Syslog Adapter]
[Syslog Adapter] -up-> [Syslog Scheduler]
[Cloud Controller] --> [MySQL Proxy]
[Firehose Exporter] -up-> [Loggregator Trafficcontroller]
[cf exporter] -up-> [Cloud Controller]
[bosh exporter] -up-> [BOSH Director]
[prometheus2] .> [Firehose Exporter] : scrape
[prometheus2] .> [cf exporter] : scrape
[prometheus2] .> [bosh exporter] : scrape
[Grafana] -down-> [prometheus2]
[prometheus2] -down-> [AlertManager]
[Nginx] -[#green]-> [prometheus2]
[Nginx] -[#green]-> [AlertManager]
[Nginx] -[#green]-> [Grafana]
Diego .> [Doppler Server] : metrics
CAPI .> [Doppler Server] : metrics
Router .> [Doppler Server] : metrics
app1 ..> [Doppler Server] : log&metrics
app2 ..> [Doppler Server] : log&metrics
app3 ..> [Doppler Server] : log&metrics
@enduml
```
### Grafanaへのアクセス
まずはGrafanaにアクセスします。`https://grafana.`にアクセスしてください。次のログイン画面が表示されます。

ユーザー名は`admin`で、パスワードはCredHubに保存されています。
CredHubにログインするためのスクリプト`credhub-login.sh`を作成します。
```
cd ~/bosh-manifests
cat <<'EOF' > credhub-login.sh
#!/bin/bash
credhub login \
-s ${BOSH_ENVIRONMENT}:8844 \
--client-name=ops_manager \
--client-secret=${BOSH_CLIENT_SECRET} \
--ca-cert ${BOSH_CA_CERT}
EOF
chmod +x credhub-login.sh
```
`credhub-login.sh`を実行します。
```
./credhub-login.sh
```
CredHubからCredentialを取得するコマンドは`credhub get -n (credential名)`で、
CredHubに登録されるCredentialの命名規則は`(director名)/(deployment名)/(variable名)`です。
Grafanaのパスワードのvariable名は`grafana_password`なので、次のコマンドで取得できます。
```
credhub get -n /p-bosh/prometheus/grafana_password
```
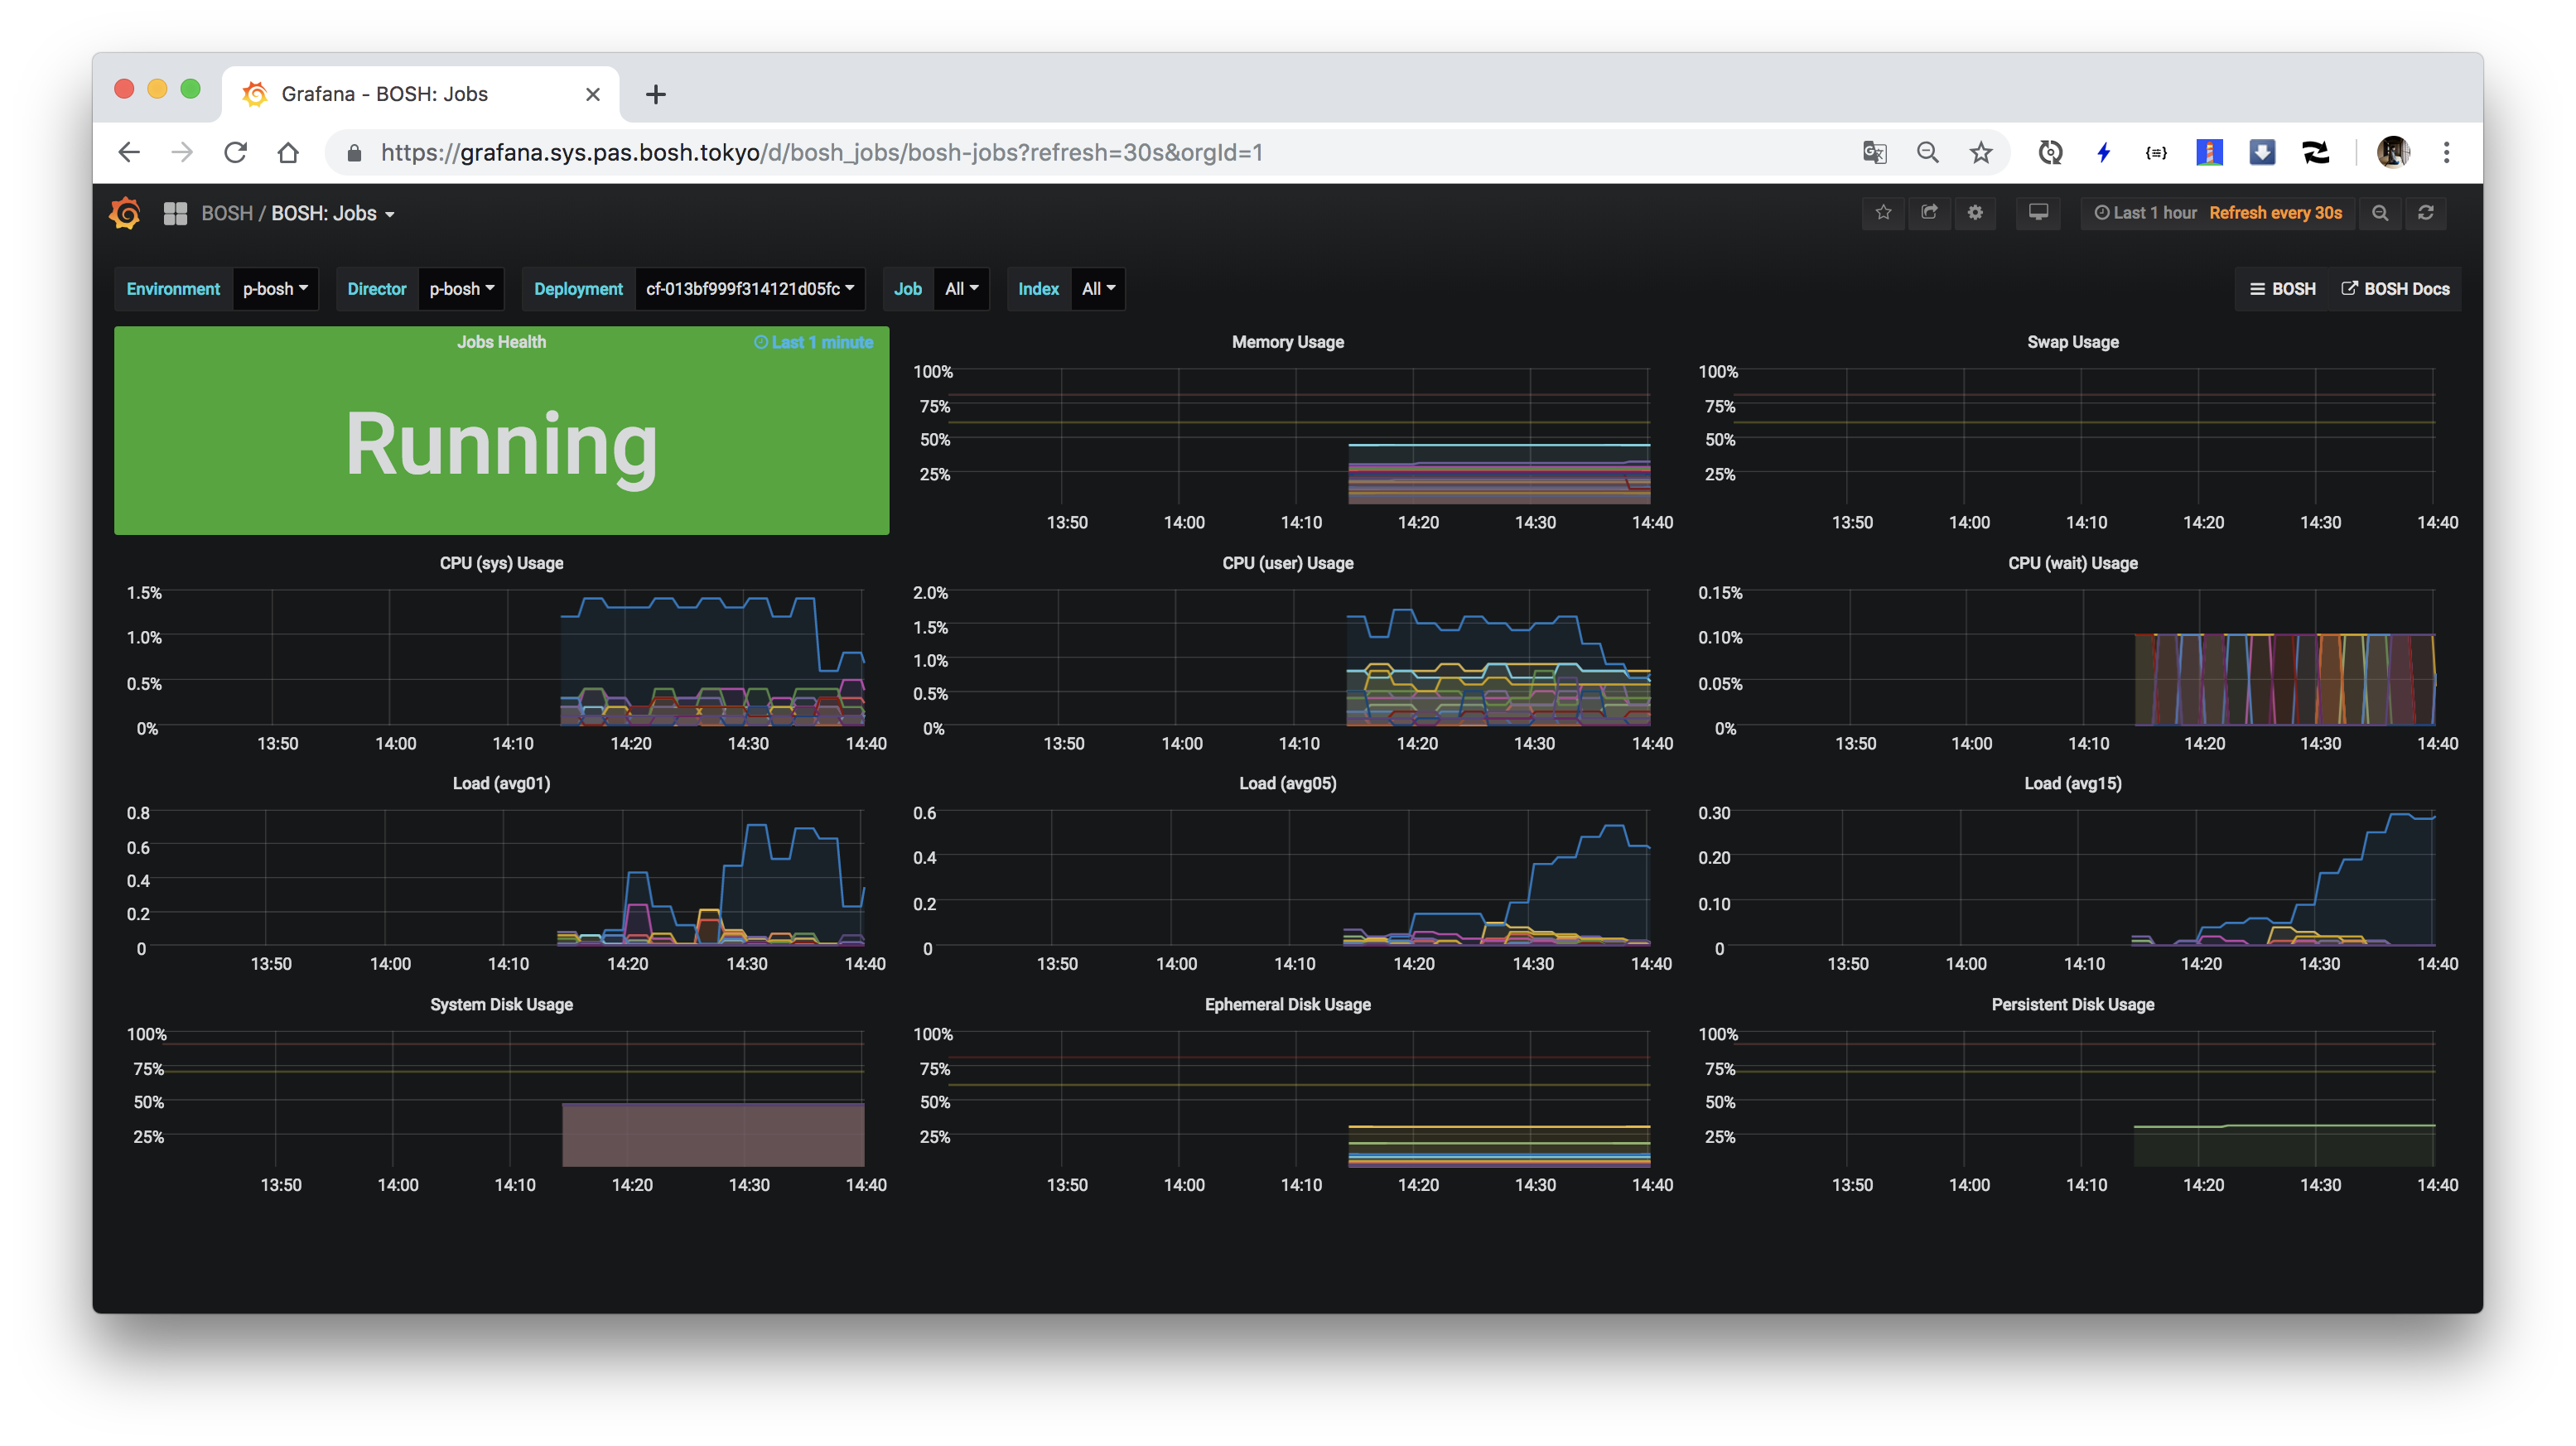
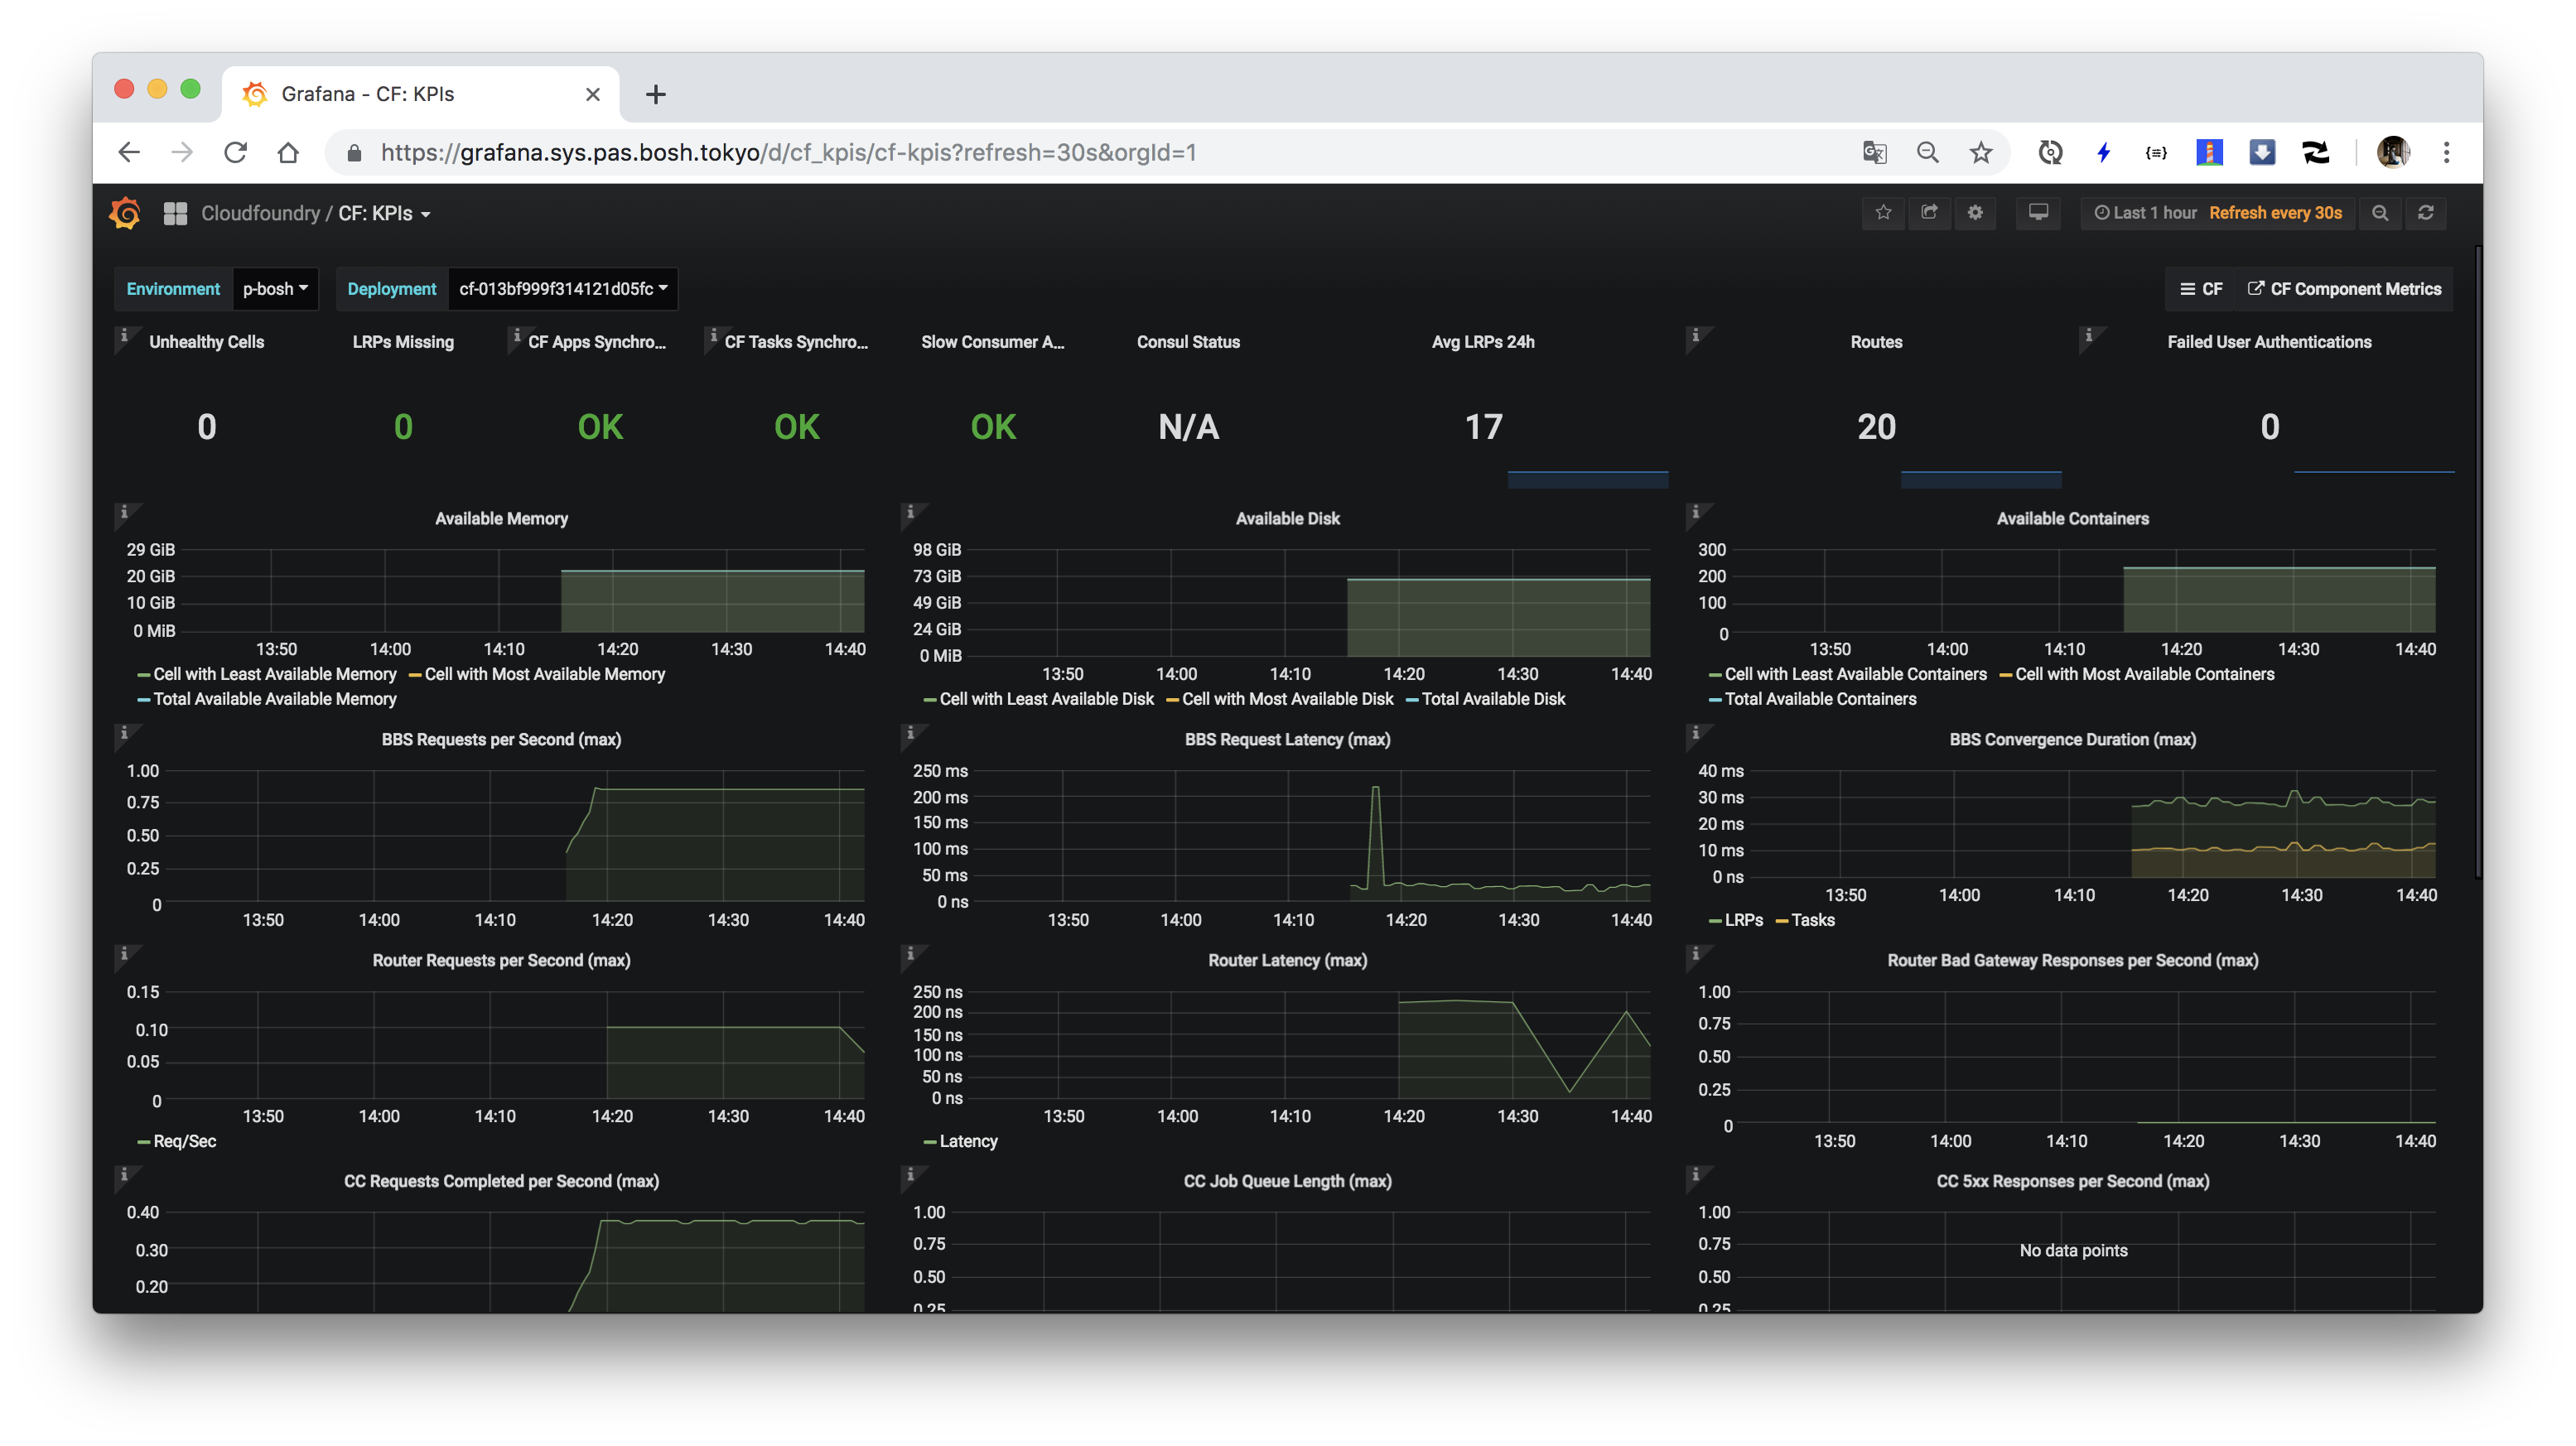
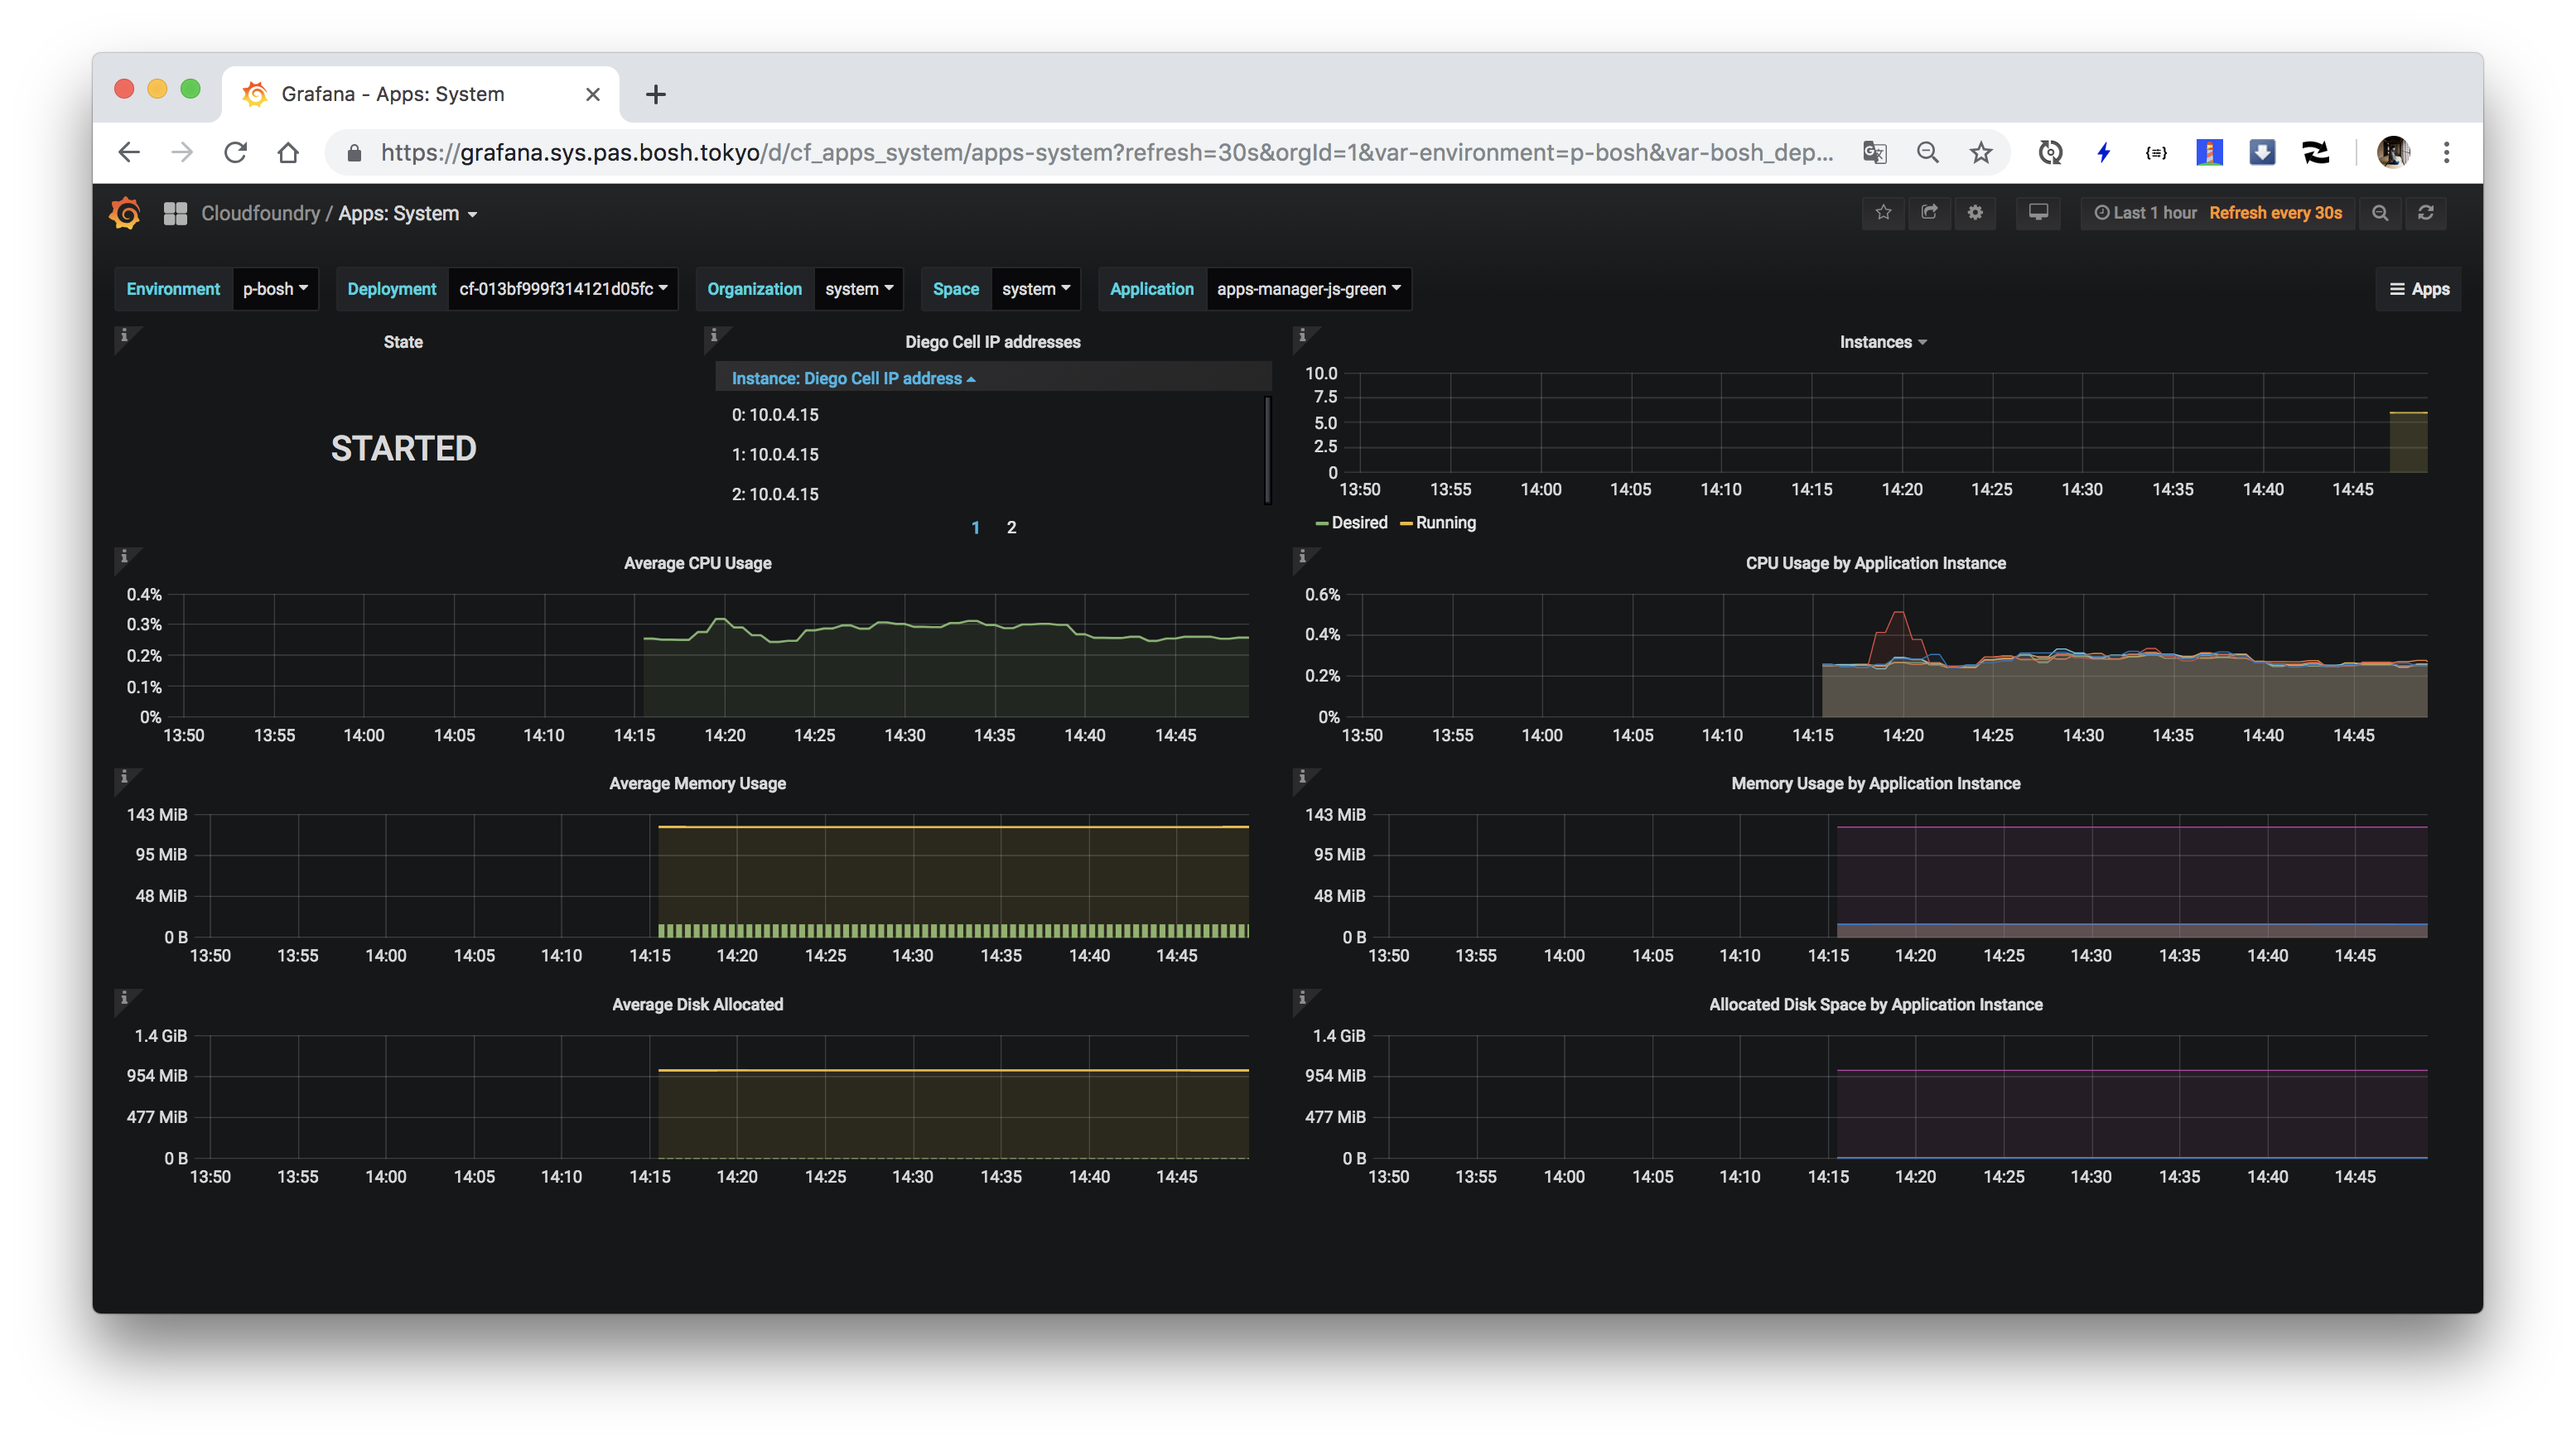
ログインして、"Home"をクリックしてDashboardをいくつか見てみてください。"BOSH"フォルダに含まれるDashboardがBOSH管理下のVMやprocessに関するメトリクスのダッシュボードで、
"Cloudfoundry"フォルダに含まれるDashboardがCloud Foundryのコンポーネントやアプリに関するメトリクスです。
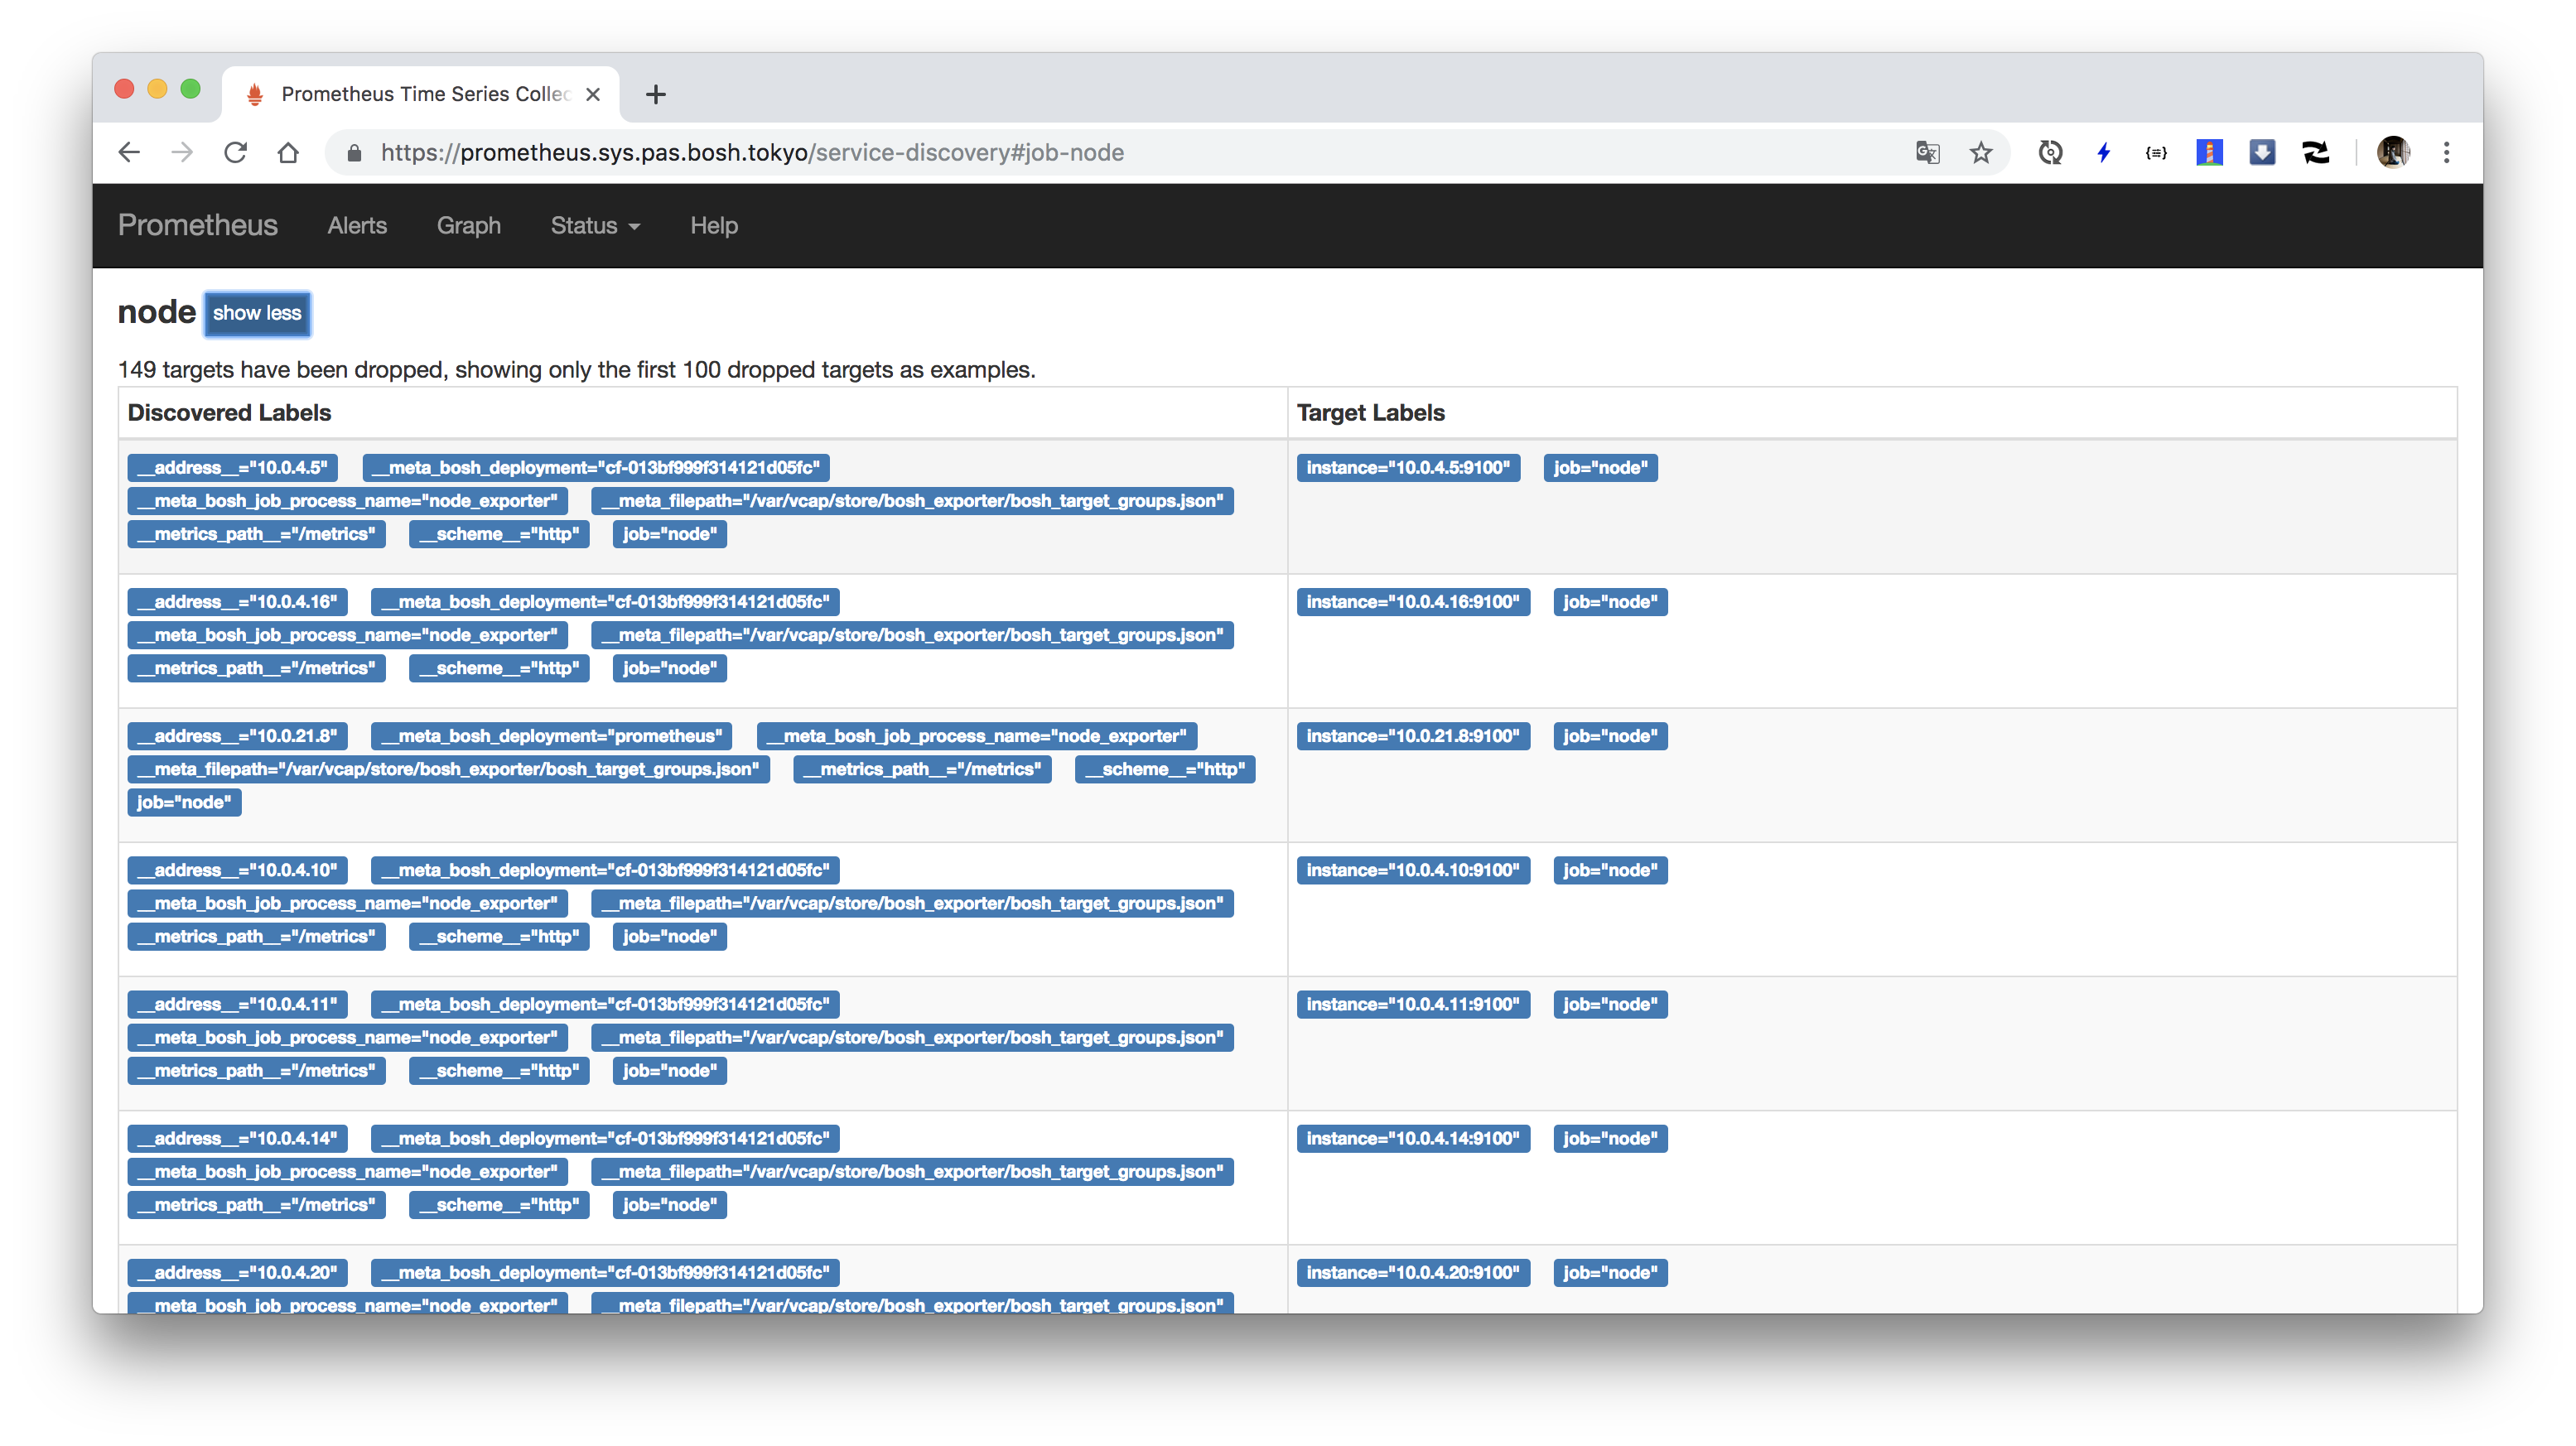
### Prometheusへのアクセス
次にPrometheusにアクセスします。`https://prometheus.`にアクセスしてください。Basic認証が求められます。
ユーザー名は`admin`で、パスワードはCredHubより、次のコマンドで取得できます。
```
./credhub-login.sh
credhub get -n /p-bosh/prometheus/prometheus_password
```
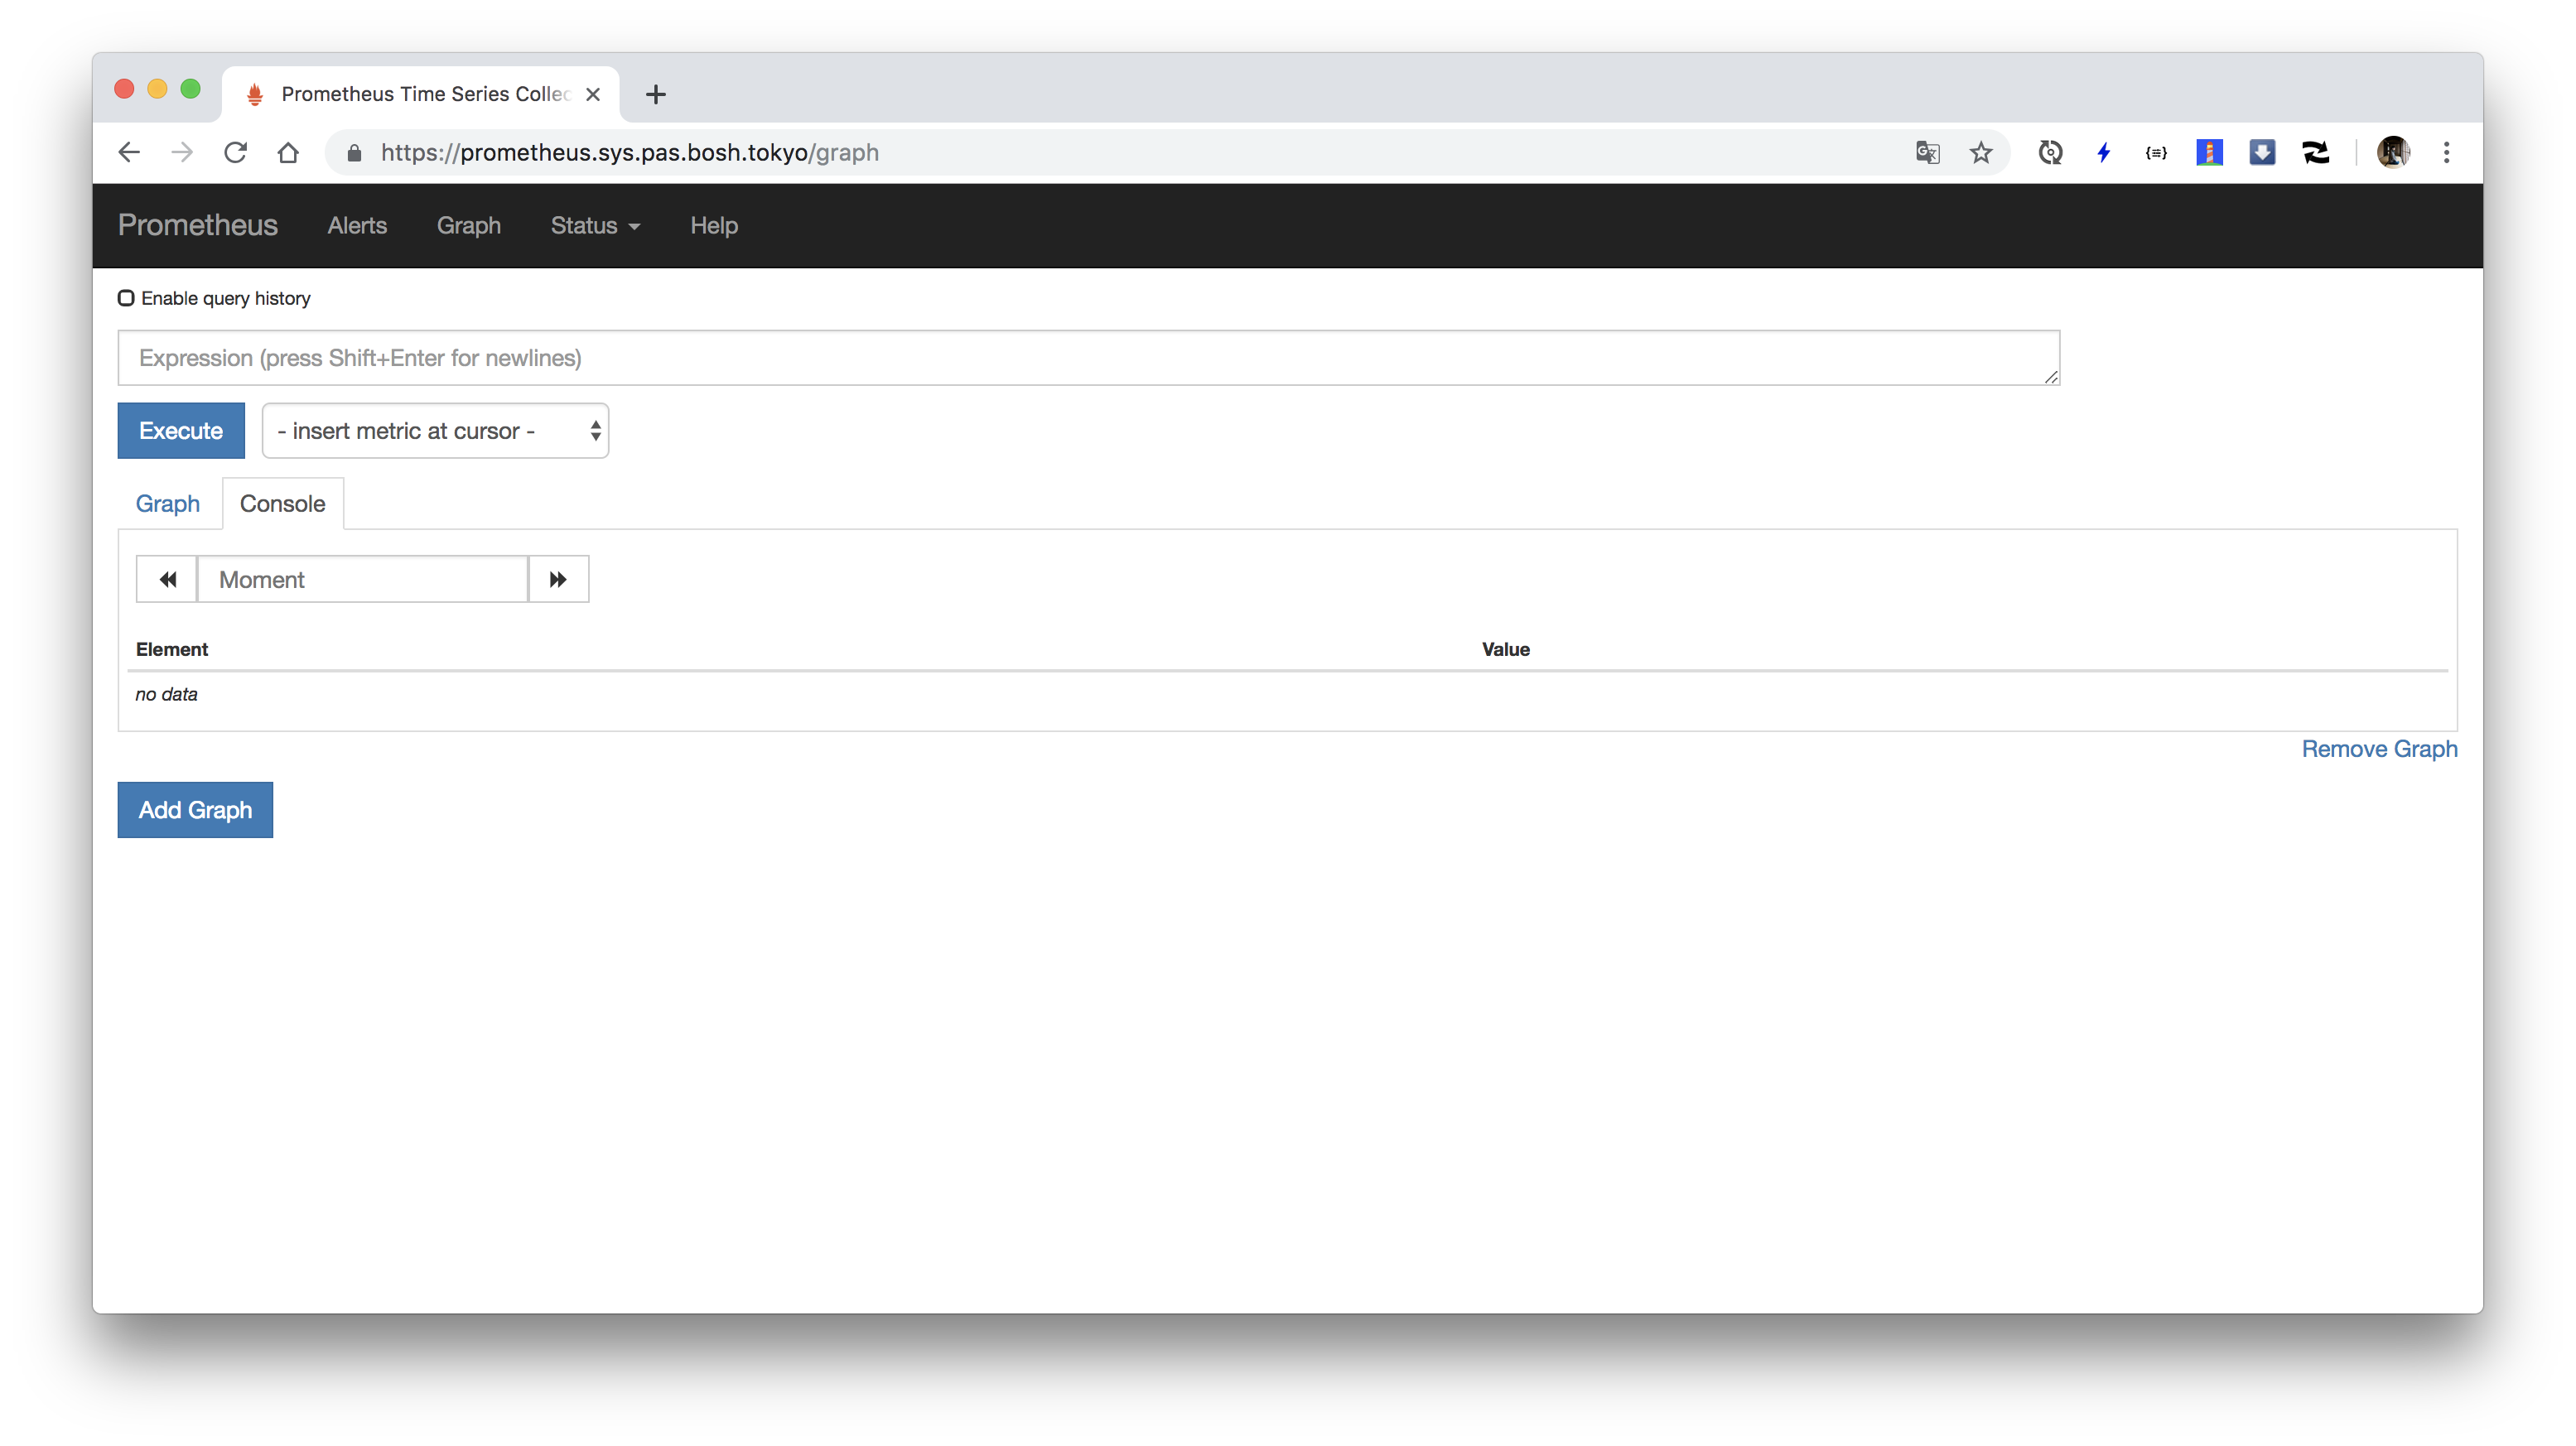
"Status" => "Target"でScrape対象のExporter一覧を確認できます。

"Status" => "Configuration"でPrometheusのconfigurationを確認できます。

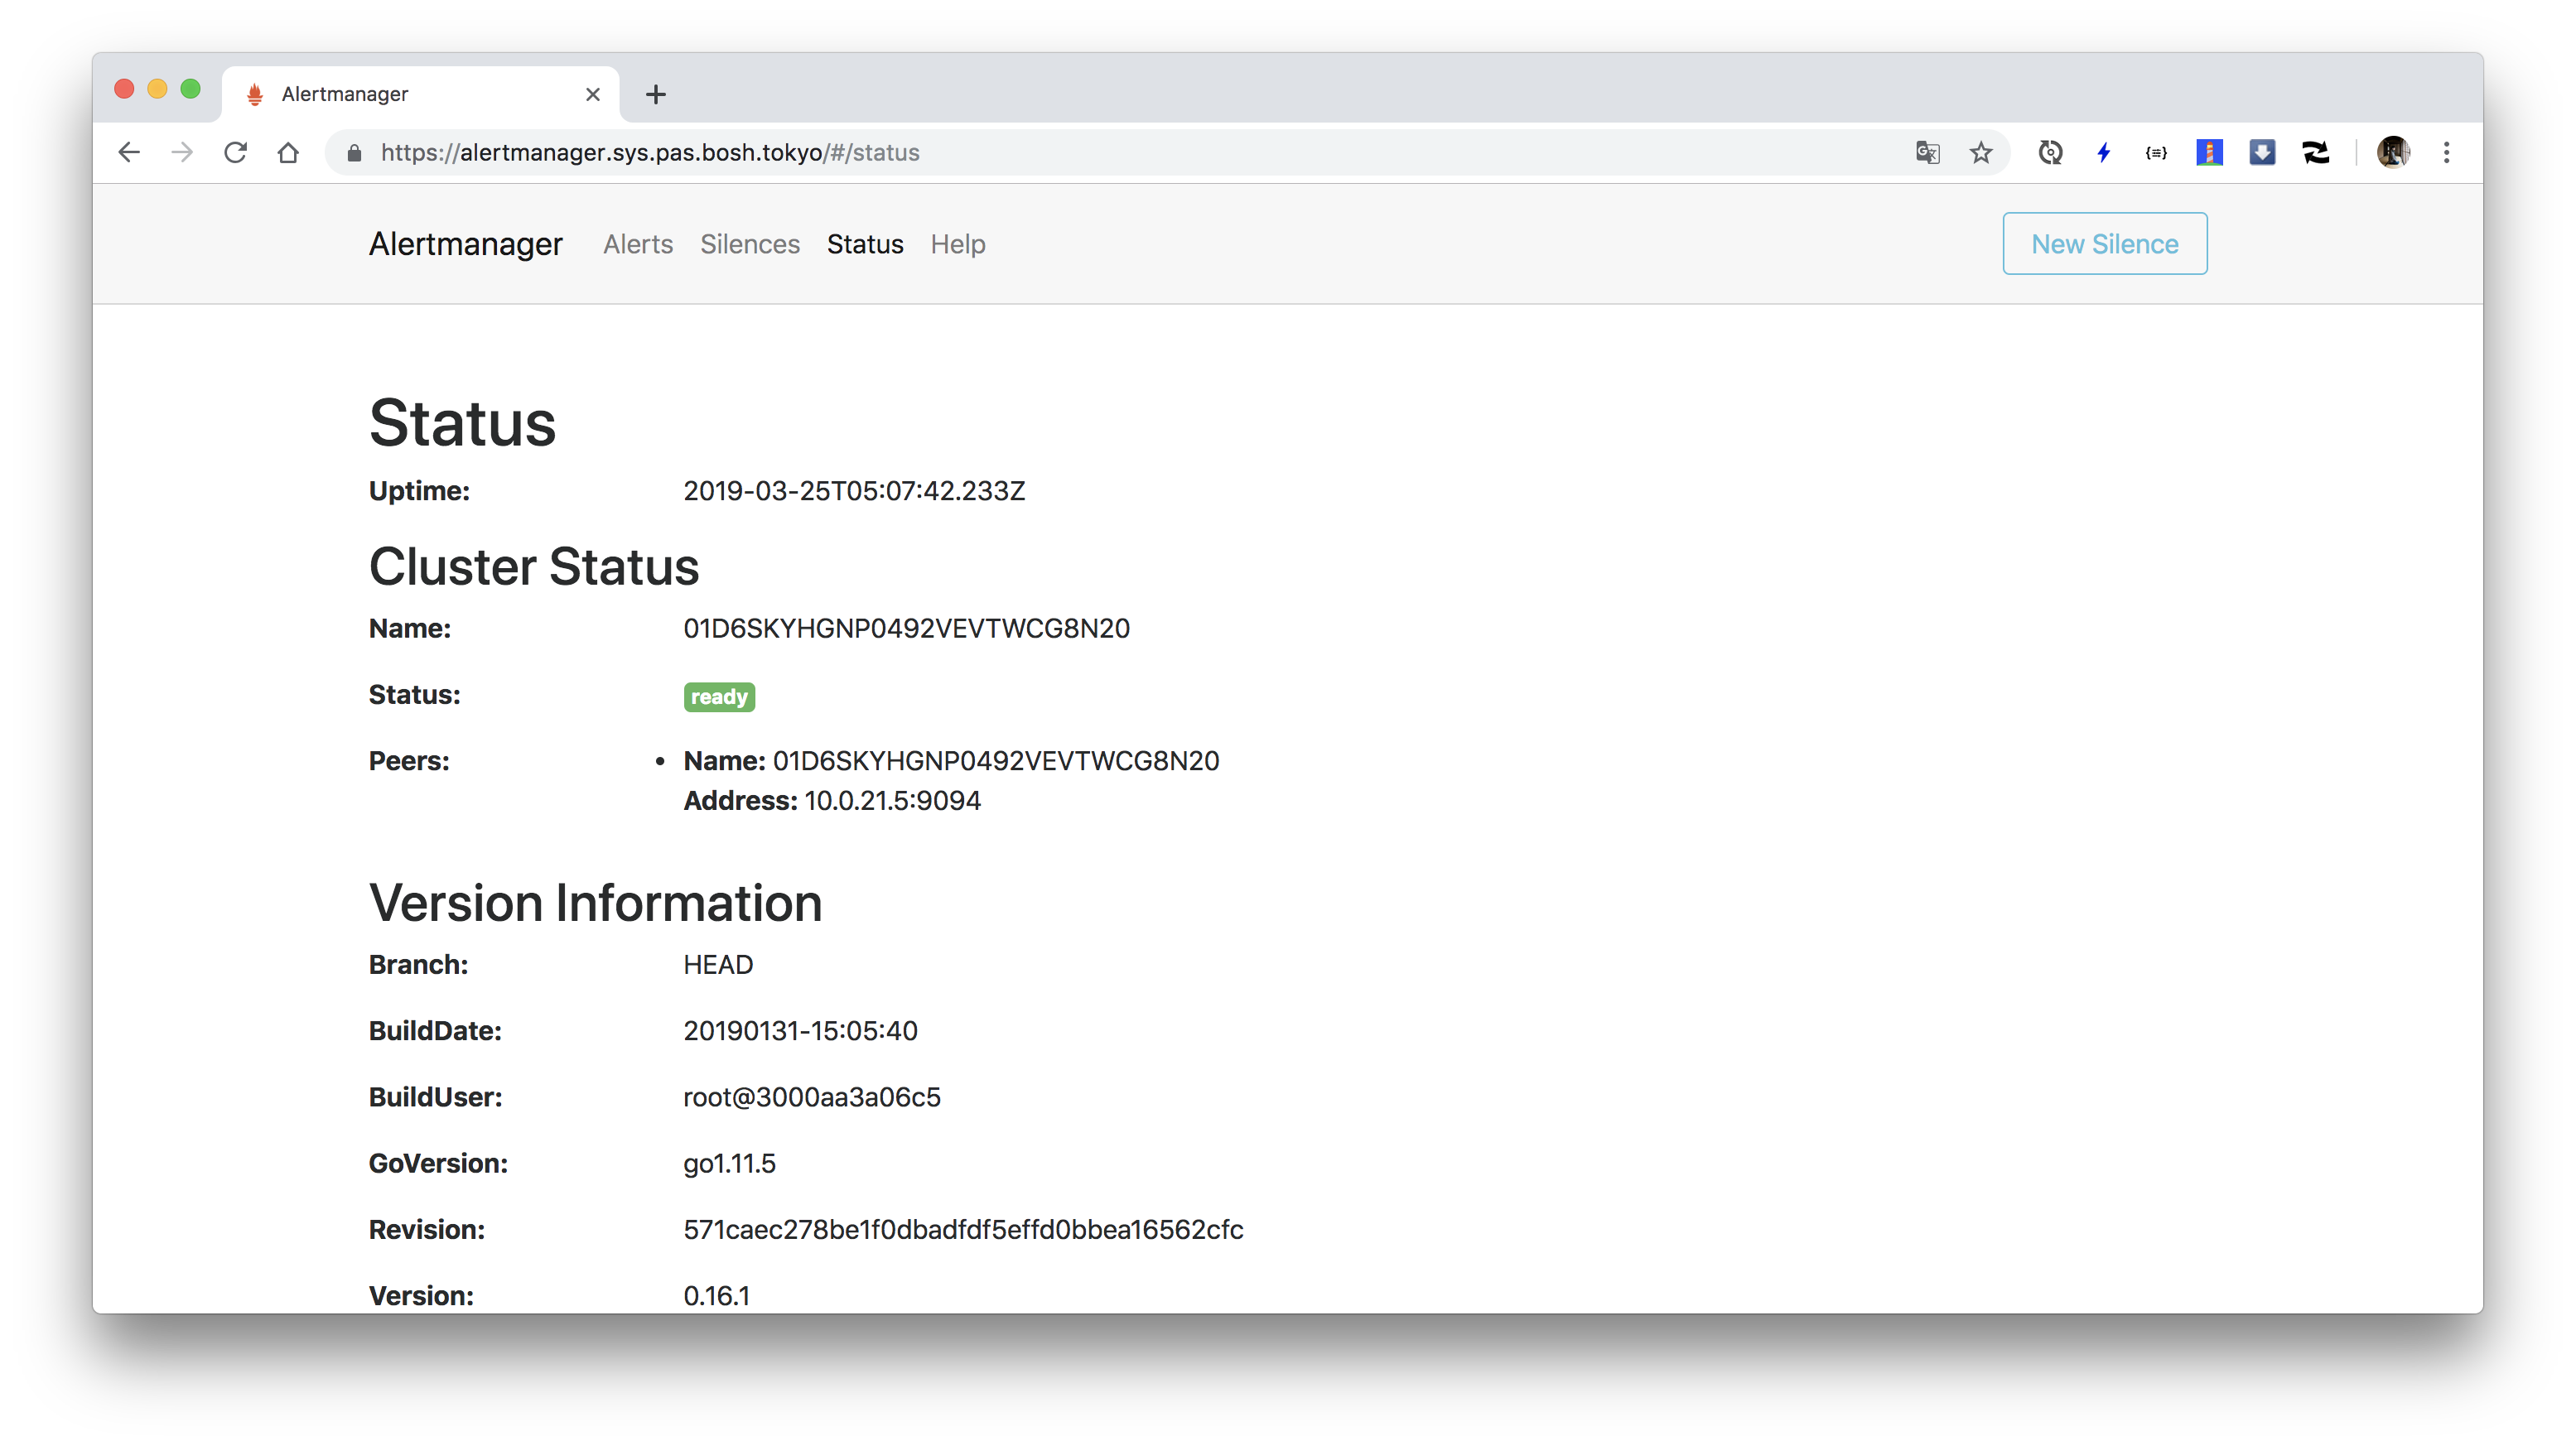
### AlertManagerへのアクセス
AlertManagerにアクセスします。`https://alertmanager.`にアクセスしてください。Basic認証が求められます。
ユーザー名は`admin`で、パスワードはCredHubより、次のコマンドで取得できます。
```
./credhub-login.sh
credhub get -n /p-bosh/prometheus/alertmanager_password
```

### Node Exporterのインストール
最後にNode Exporterを導入します。Node ExporterはVMのメトリクスを取得するExporterです。
BOSH Exporterで取得できるメトリクスと一部重複しますが、BOSH Exporterに比べて、low levelなメトリクスが取得可能です。
また、BOSH ExporterはBOSH Director経由でメトリクスを取得しますが、Node Exporterはモニタリング対象のVM上でメトリクスを取得します。
これによりBOSH Directorがダウンして、VMのメトリクスが取れなくなるという状況を回避できます。
BOSH管理下の全てのVMにprocessを追加する場合にはRuntime Configを利用できます。
次のコマンドを実行して、`node-exporter.yml`を作成してください。
```
cd ~/bosh-manifests
cat <<'EOF' > node-exporter.yml
releases:
- name: node-exporter
version: 4.1.0
url: https://github.com/bosh-prometheus/node-exporter-boshrelease/releases/download/v4.1.0/node-exporter-4.1.0.tgz
sha1: bc4f6e77b5b81b46de42119ff1a9b1cf5b159547
addons:
- name: node-exporter
jobs:
- name: node_exporter
release: node-exporter
properties: {}
include:
stemcell:
- os: ubuntu-trusty
- os: ubuntu-xenial
EOF
```
次のコマンドでRuntime Configを設定してください。
```
bosh update-runtime-config --name=node-exporter node-exporter.yml
```
Runtime Configは`bosh configs`で確認可能です。
```
bosh configs
```
出力結果
```
Using environment '10.0.16.5' as client 'ops_manager'
ID Type Name Team Created At
3 cloud default - 2019-03-24 15:10:12 UTC
6 cloud bosh - 2019-03-24 18:43:07 UTC
4 cpi default - 2019-03-24 15:10:19 UTC
5 runtime cf-013bf999f314121d05fc-bosh-dns-aliases - 2019-03-24 15:10:45 UTC
2 runtime director_runtime - 2019-03-24 15:10:11 UTC
7 runtime node-exporter - 2019-03-25 05:59:24 UTC
1 runtime ops_manager_dns_runtime - 2019-03-24 15:10:07 UTC
7 configs
Succeeded
```
Runtime Configの反映は`bosh update-runtime-config`を実行した後、各deploymentを再度deployしたタイミングで行われます。
したがって、PASの各VMに反映するにはOps ManagerのApply Changesが必要で、Prometheusの各VMに反映するには`./deploy-prometheus.sh`の再実行が必要です。
OpsManagerのGUIで"REVIEW PENDING CHANGES" => "APPLY CHANGES"をクリックするか、`om apply-changes`コマンドを実行して、
PASの各VMに対してnode-exporterを組み込んでください。
また、prometheus deploymentに対してもnode-exporterを組み込むために
```
./deploy-prometheus.sh
```
を再度実行してください。
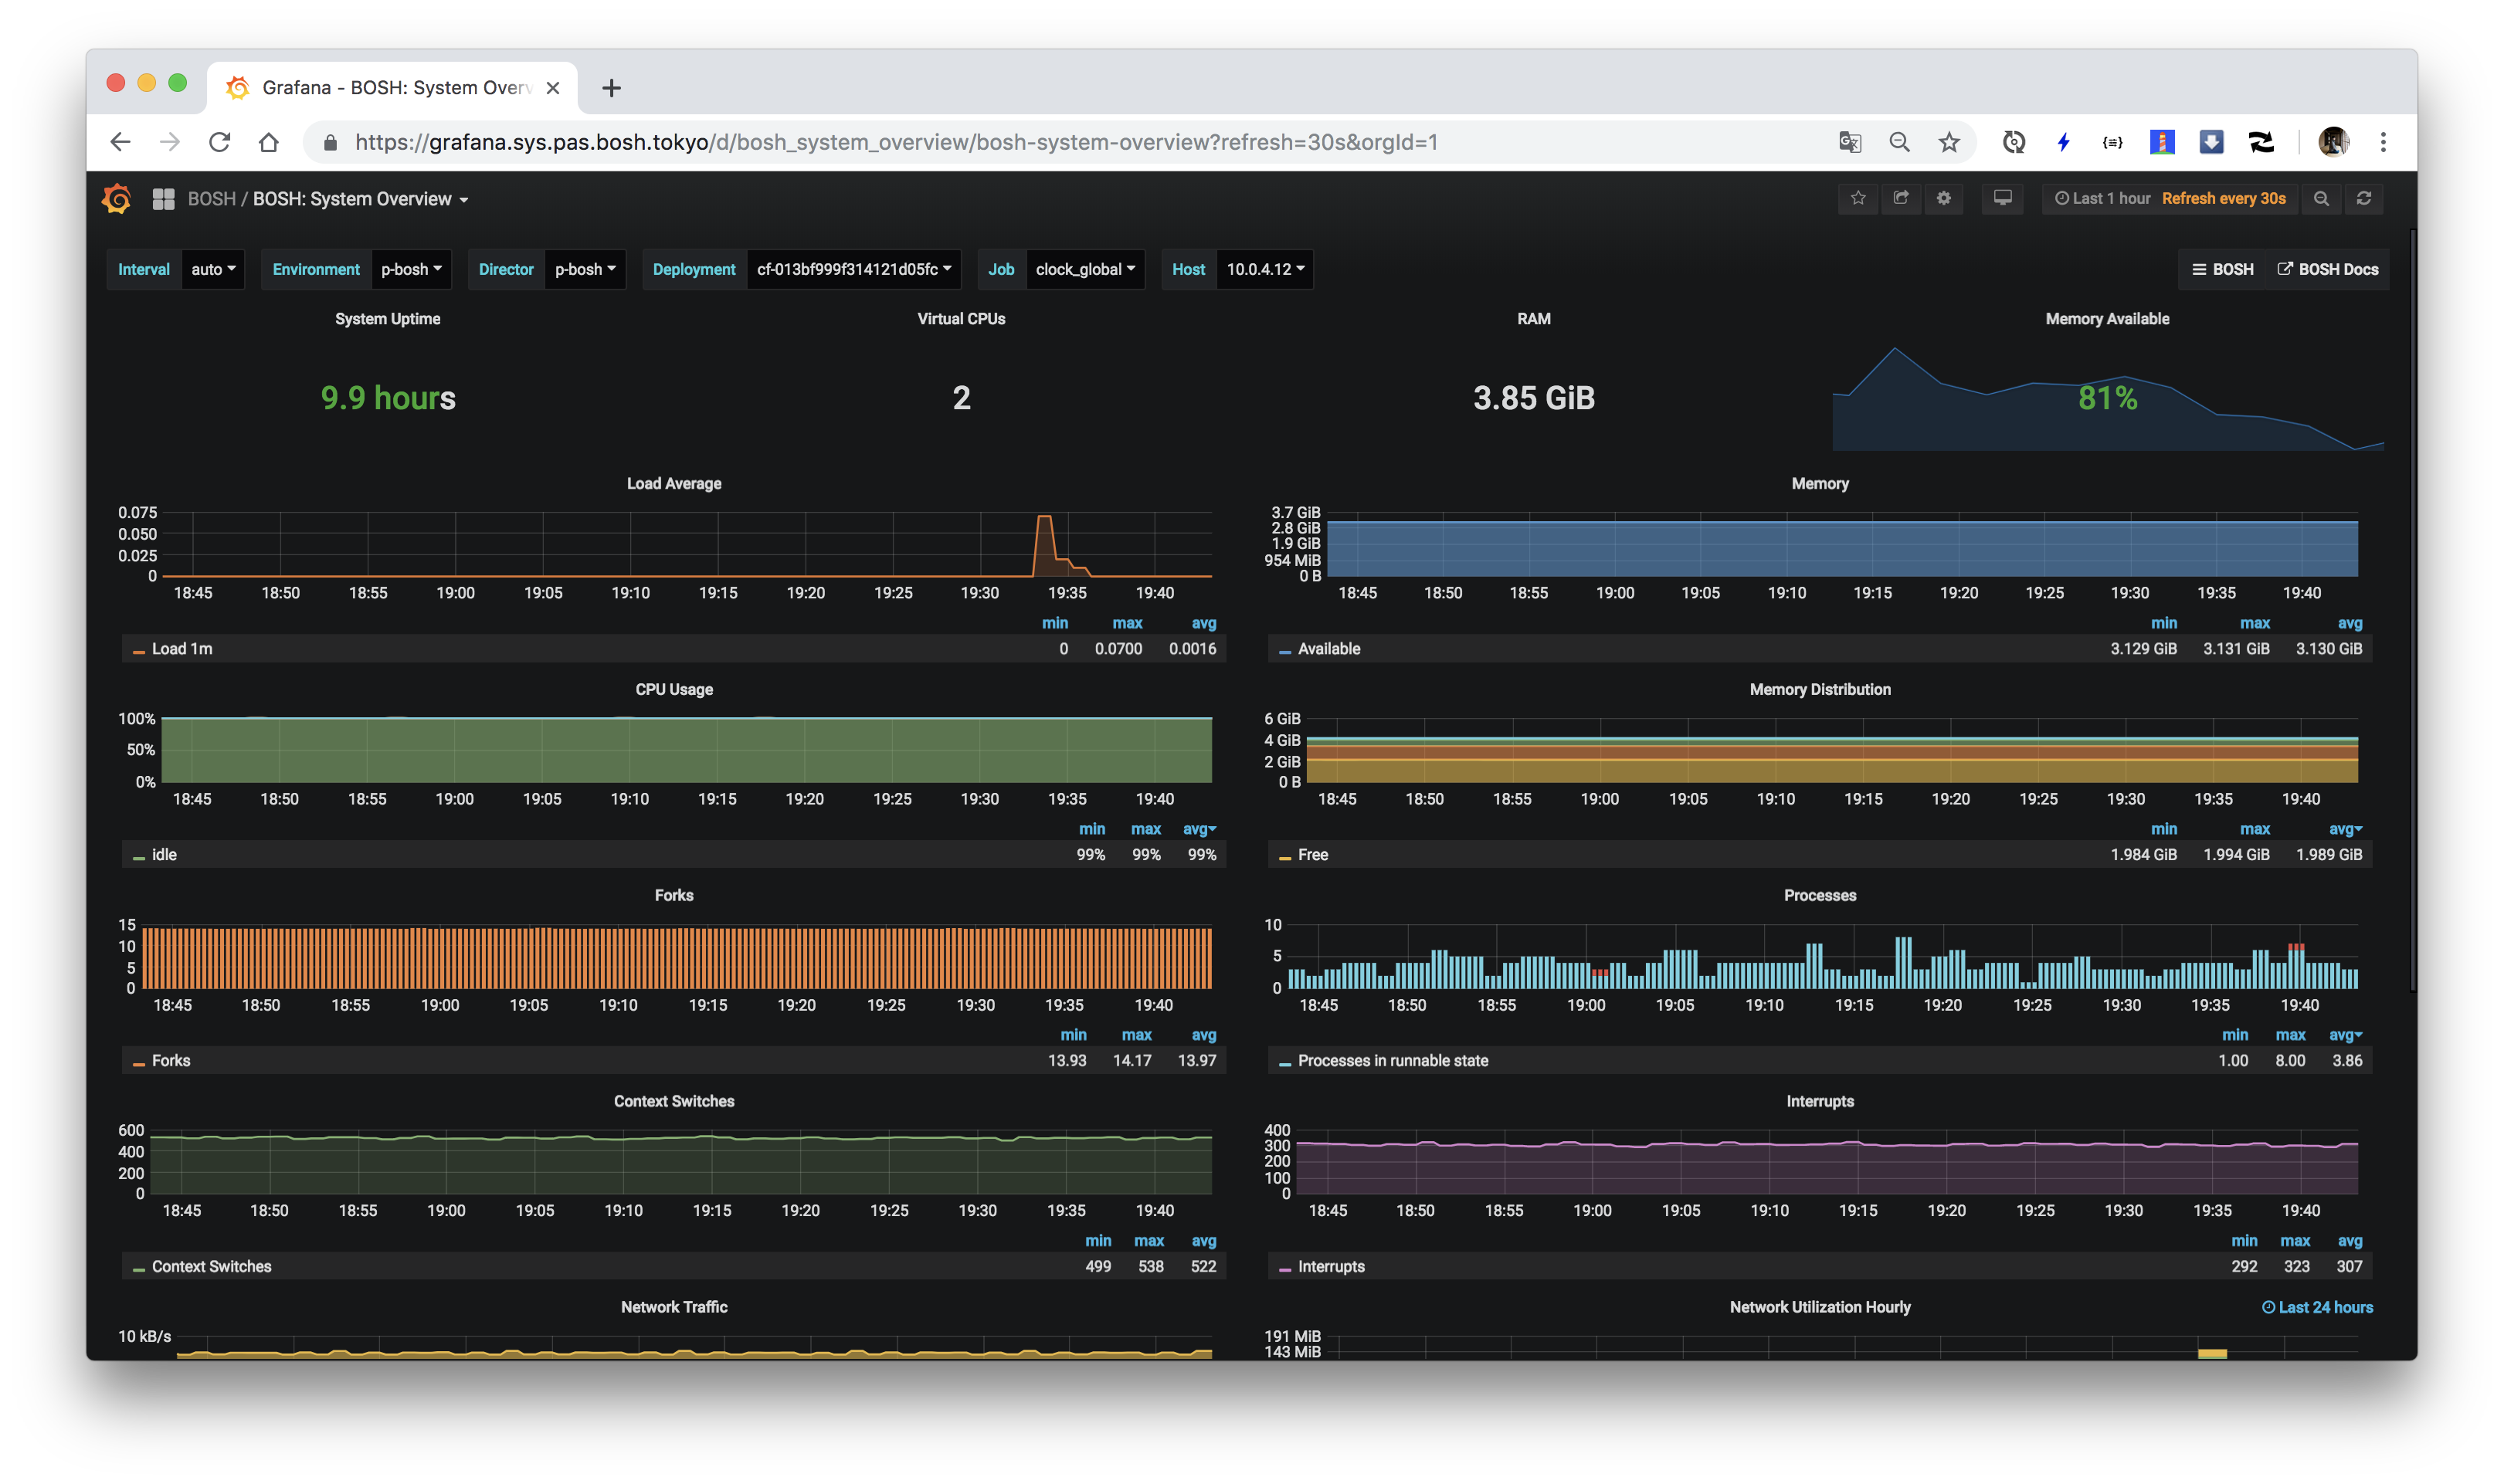
デプロイ後しばらくすると、Grafanaの"BOSH: System XXXX"ダッシュボードでメトリクスが見れるようになります。
### AlertManagerの通知先設定
TBD