---
title: Pivotal Application Service上のアプリメトリクスをPrometheusでScrapeする方法
tags: ["Cloud Foundry", "Pivotal Cloud Foundry", "Prometheus", "Promregator", "Spring Boot", "Micrometer", "RSocket"]
categories: ["Dev", "PaaS", "CloudFoundry", "PCF", "Monitoring"]
date: 2019-08-21T03:58:30Z
updated: 2019-09-02T02:14:13Z
---
Pivotal Application Service (Cloud Foundry)上にデプロイしたアプリケーションのメトリクスをPrometheusからScrapeしたい時の問題と2019年8月時点での解決法について説明します。
**目次**
### 問題
例えば`https://example.apps.my-paas.example.com`にルーティングされるアプリケーションに対する次のようなScrape Configを設定したとします。
```yaml
scrape_configs:
- job_name: example
scrape_interval: 60s
scrape_timeout: 10s
scheme: https
static_configs:
- targets:
- example.apps.my-paas.example.com:443
metrics_path: /actuator/prometheus
```
この設定は`example`アプリが1インスタンスの場合は問題ありません。ところが2以上にスケールアウトした場合は、
次の図で示されるようにGoRouterによってラウンドロビンされるため、Prometheusはどれか1インスタンスのメトリクスを順番に保存していくため、全インスタンスのメトリクスを取得するということができません。
例えば`cf_instance_id`のようなインスタンス単位で一意なラベルを付与してもちぐはぐなグラフになってしまいます。

GoRouterを経由して特定のインスタンスにアクセスしたい場合は、[ドキュメント](https://docs.pivotal.io/pivotalcf/2-6/concepts/http-routing.html#app-instance-routing)に記載されているように、`X-CF-APP-INSTANCE`ヘッダーに`YOUR-APP-GUID:YOUR-INSTANCE-INDEX`を指定する必要があります。
例えば`example`アプリの`0`番目のインスタンスに`curl`でアクセスしたい場合は、`-H "X-CF-APP-INSTANCE: $(cf app example --guid):0"`を付与します。
PrometheusのConfigでこのヘッダーを設定することは出来ません。
### 解決法
この課題に対して、いくつか解決方法(回避方法?)があります。
> TODO: [Push Gateway](https://prometheus.io/docs/practices/pushing/)についても書く
#### Promeregator
* https://github.com/promregator/promregator
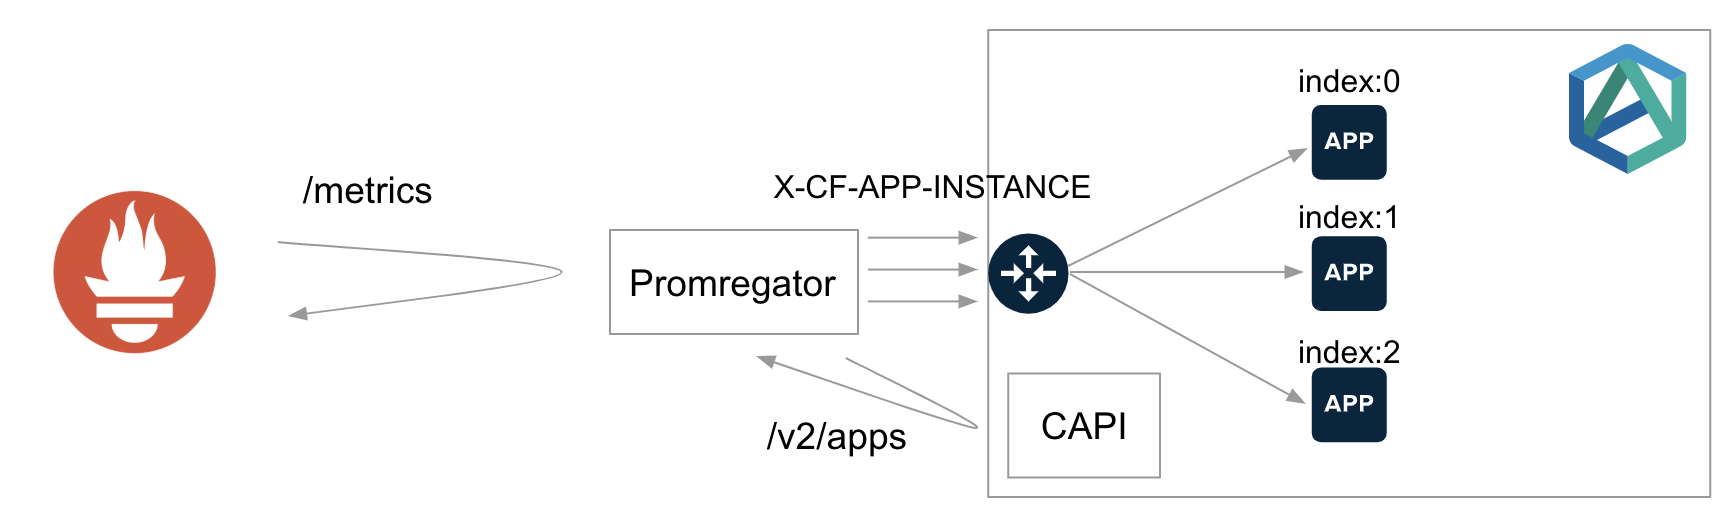
Promregatorは名前の通り、"Prometheus Aggregator"の役割を担います。PAS 2.3まではこれを使わざるを得ませんでいた。
PromregatorはCAPIにアクセスすることでApp GUIDを取得し、全インスタンスのメトリクスエンドポイントに対して`X-CF-APP-INSTANCE`ヘッダーを付与してアクセスします。
PromethesuはPromregatorに対して集約されたメトリクスを取得します。
Promregatorは`cf push`でデプロイすることも出来ますが、この場合はスケールアウトはできません。
デプロイ方法は[こちらの記事](/entries/485)を参考にしてください。
Promregator自体をスケールアウトしたい場合は、VMやKubernetes上に置く必要があります。
#### Metric Registrar
* https://docs.pivotal.io/pivotalcf/2-6/metric-registrar/index.html
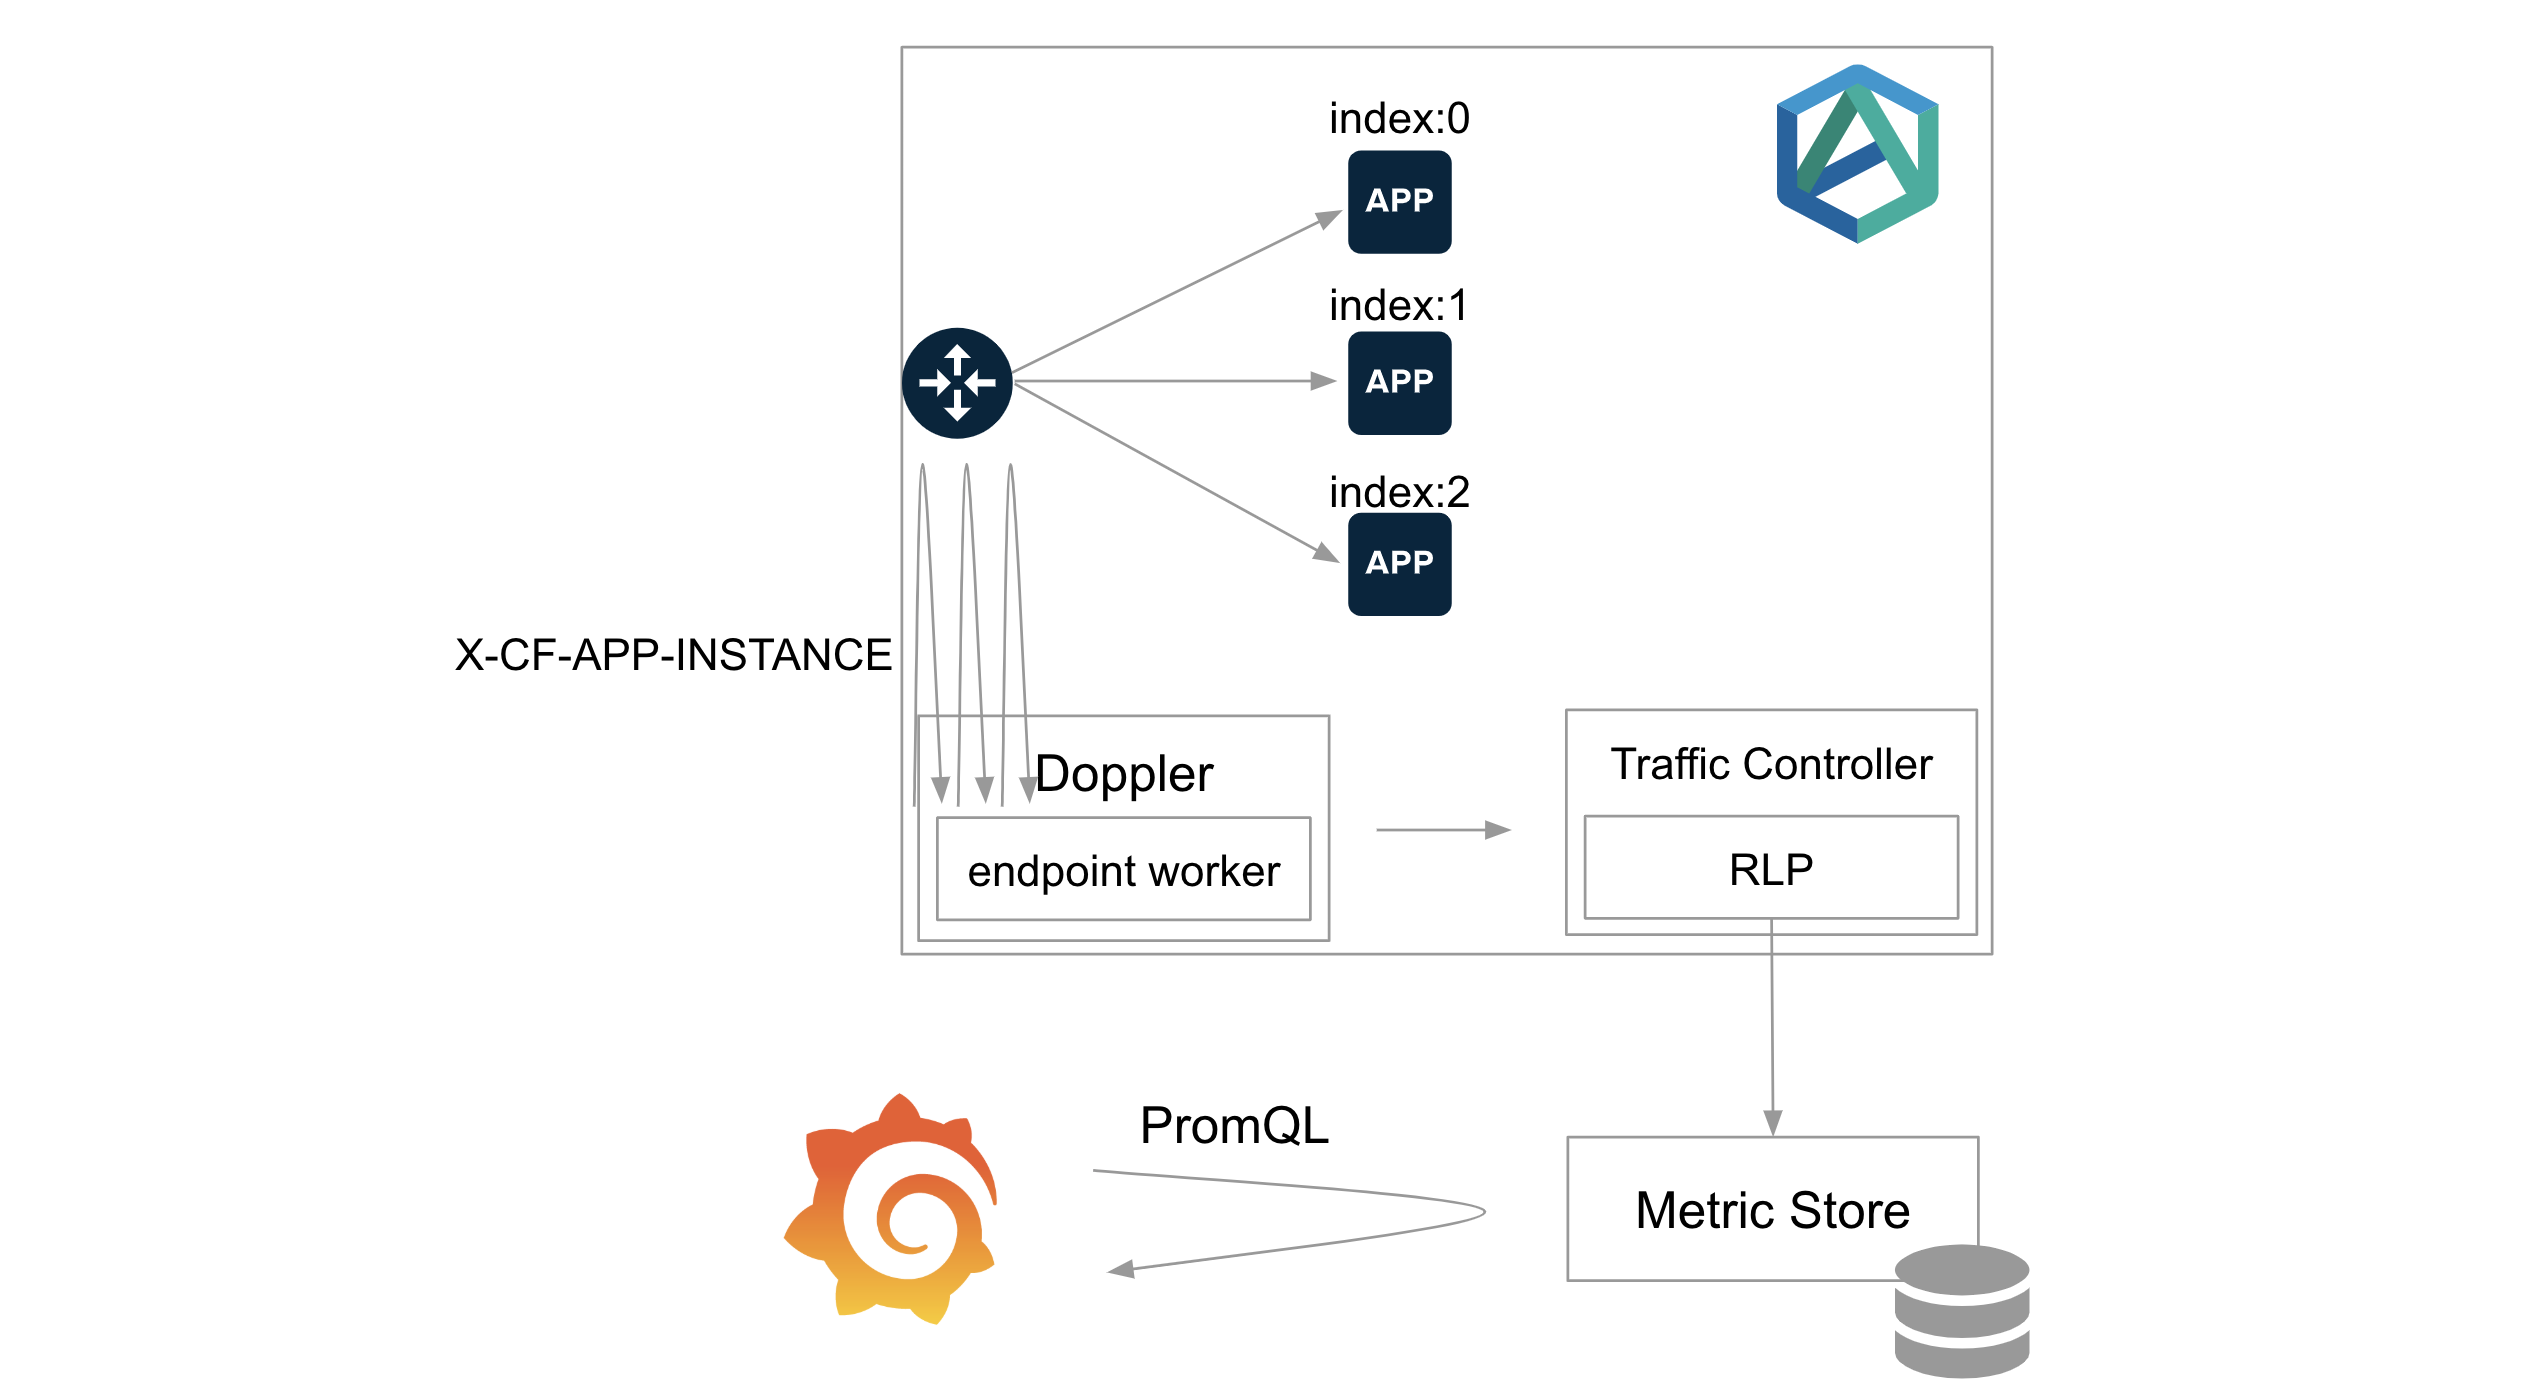
PAS 2.4からMetric Registrarが導入されました。これは直接Prometheusがアプリのメトリクスエンドポイントにアクセスするのではなく、Doppler上のMetric Registrar Endpoint Workerが全インスタンスのメトリクスエンドポイントに対して`X-CF-APP-INSTANCE`ヘッダーを付与してアクセスします
Metric Registrar Endpoint WorkerがScrapeしたメトリクスは変換されFirehoseに送られます。Firehoseから再びPrometheusにメトリクスを保存する方法は後述します。

アプリ毎のメトリクスエンドポイントの定義は[ドキュメント](https://docs.pivotal.io/pivotalcf/2-6/metric-registrar/using.html)で説明されているように、CF CLIのプラグインである[Metric Registrar CLI](https://github.com/pivotal-cf/metric-registrar-cli)を使って行います。
`example`アプリの`/actuator/prometheus`をScrapeして欲しい場合は、次のコマンドで設定できます。
```
cf register-metrics-endpoint example /actuator/prometheus
```
> このコマンドはこの記事の作成時点では次のコマンドと等価です。
>
> ```
> cf create-user-provided-service metrics-endpoint-actuator-prometheus -l metrics-endpoint:///actuator/prometheus
> cf bind-service example metrics-endpoint-metrics
> ```
>
> 将来的には実装が変わる可能性があるので、`cf register-metrics-endpoint` でサービスインスタンスを作ってサービスインスタンス名を`manifest.yml`の`serviecs`フィールドに追加しておくのが良いでしょう。
制約としては、Metric Registrar Endpoint Workerに認証情報を渡す方法がなく、エンドポイントに認証を設定することができません。
Workaroundとしては、PrometheusエンドポイントへのアクセスをDoppler VMのIPからのみ許可するように設定することで一般ユーザーにアクセスされることを防げます。
> Spring Securityの場合は[`hasIpAddress`](https://www.baeldung.com/spring-security-whitelist-ip-range)でホワイトリストの設定が可能です
この制約を許容できない場合は、[Structured Log Format](https://docs.pivotal.io/pivotalcf/2-6/metric-registrar/using.html#register-log-format)で代替できます。
この場合はPrometheusエンドポイントを用意する代わりに、[DogStatsD形式](https://docs.pivotal.io/pivotalcf/2-6/metric-registrar/using.html#-dogstatsd)または[JSON形式](https://docs.pivotal.io/pivotalcf/2-6/metric-registrar/using.html#-json)でメトリクスをログとして標準出力に出力すれば、Firehoseに転送できます。
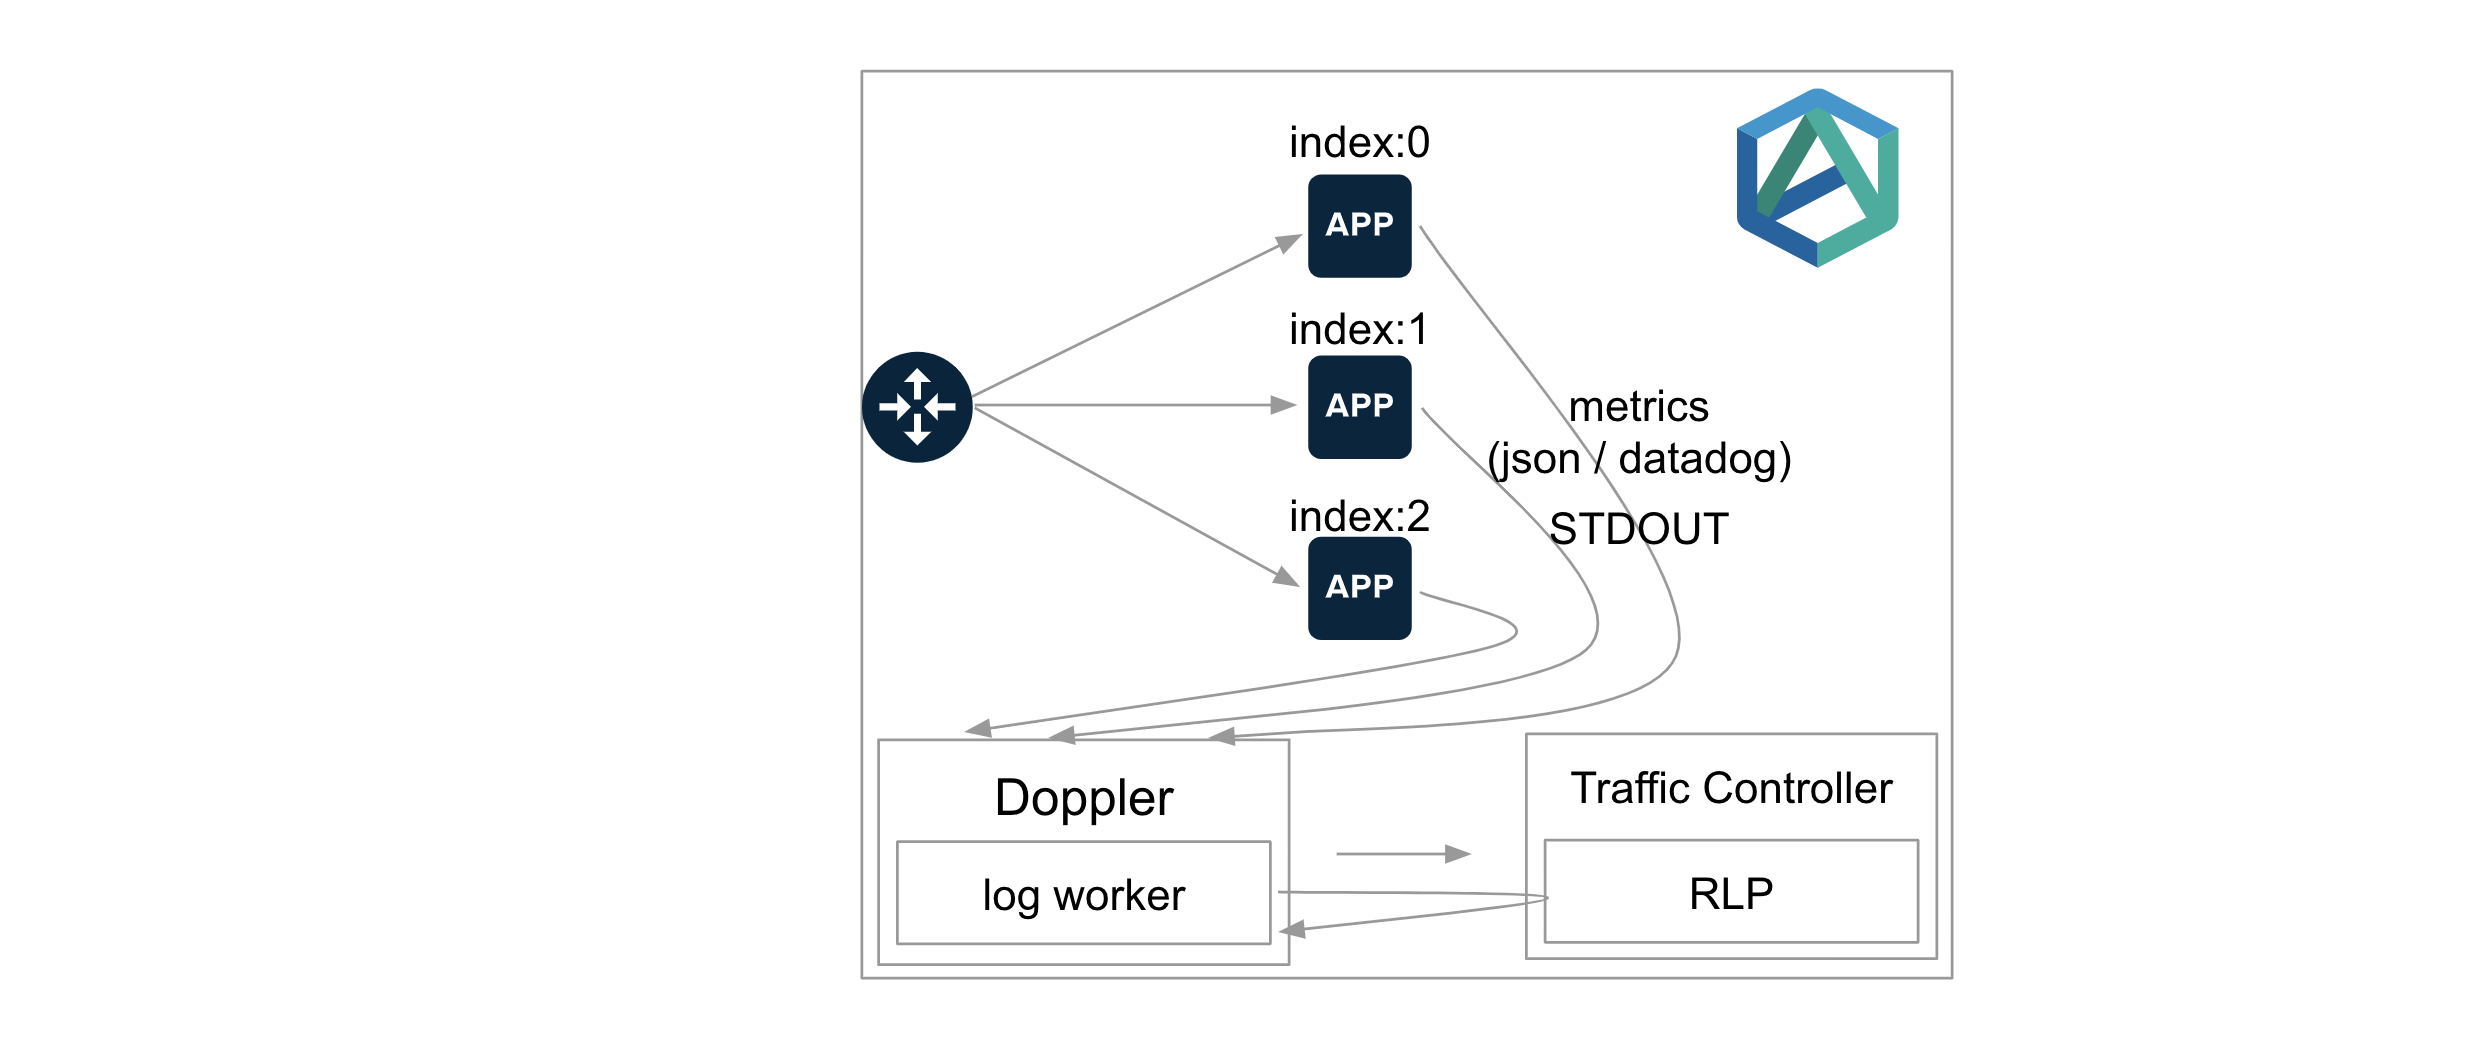
> [Micrometer](https://micrometer.io/)を使っている場合は[StatsD Registry](https://micrometer.io/docs/registry/statsD)のDatadog Flavorを使用し、`lineSink`メソッドで標準出力にメトリクスを出力すれば良いです。
Firehoseに送られたメトリクスをPrometheusに保存するにはExporterが必要です。Firehose -> PrometheusのExporterとしては次の2つがあります。
* Firehose Exporeter(OSS): https://github.com/bosh-prometheus/firehose_exporter
* Reliability View Exporter for PAS: https://docs.pivotal.io/reliability-view
PASを使う場合はReliability View Exporter for PASを使えば良いと思います。
> Firehose Exporeterはメトリクス名に[Prefix](https://github.com/bosh-prometheus/firehose_exporter/blob/master/FAQ.md#valuemetric-metrics)が付くため、Grafana Dashboardが作りにくいです。
PrometheusのScrape ConfigにはこのExporterの設定を行えば良いです。次の図のような構成になります。

Firehoseに送らられたメトリクスはPrometheus CompatibleなMetric Storeに長期間保存することができます。
Metric Storeはこちら。
* OSS版: https://github.com/cloudfoundry/metric-store-release
* Enterprise版: https://docs.pivotal.io/metric-store
> OSS版はSingle NodeでEnterprise版はMulti Nodes/HAに対応しています。
この場合はGrafanaからPrometheusデータソースとして直接Metric Storeを登録可能です。
Metric StoreはUAAと連携して、Developerがデプロイしたアプリのメトリクスのみ取得できるように認可制御させることもできます。
Grafanaの設定方法は[こちら](https://github.com/cloudfoundry/metric-store-release/blob/develop/docs/setup-grafana.md)を参照してください。
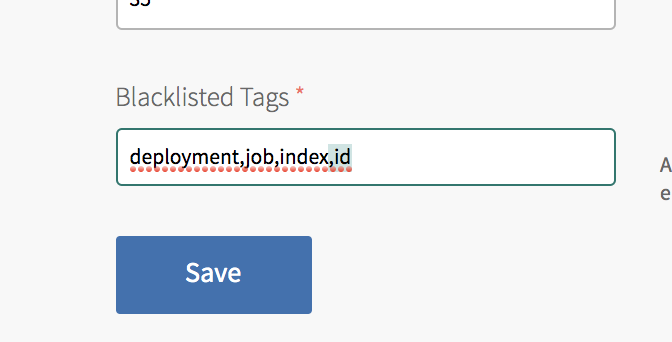
> Metrics Registrarはデフォルトで、`deployment`、`job`、`index`、`id`タグ(Prometheusのラベル)を取り除いてFirehoseに送ります。
> [Micrometer](https://micrometer.io/)を使っている場合は`id`タグはメトリクスを区別するのに重要な情報なので、**Blacklisted Tagsから`id`を除外してください**。
> 
#### Prometheus RSocket Proxy
* https://github.com/micrometer-metrics/prometheus-rsocket-proxy
最も新しい解決方法がPrometheus RSocket Proxyです。
[RSocket](https://rsocket.io/)プロトコルを使用して、アプリとPrometheus Proxyが双方向に通信します。
PromethesuはPrometheus RSocket Proxyに対して集約されたメトリクスを取得します。
Promregatorと少し似ていますが、Promregatorとは異なり、Prometheus RSocket ProxyからアプリへのアクセスはLoad BalancerやGoRouterや経由せず直接通信になります。
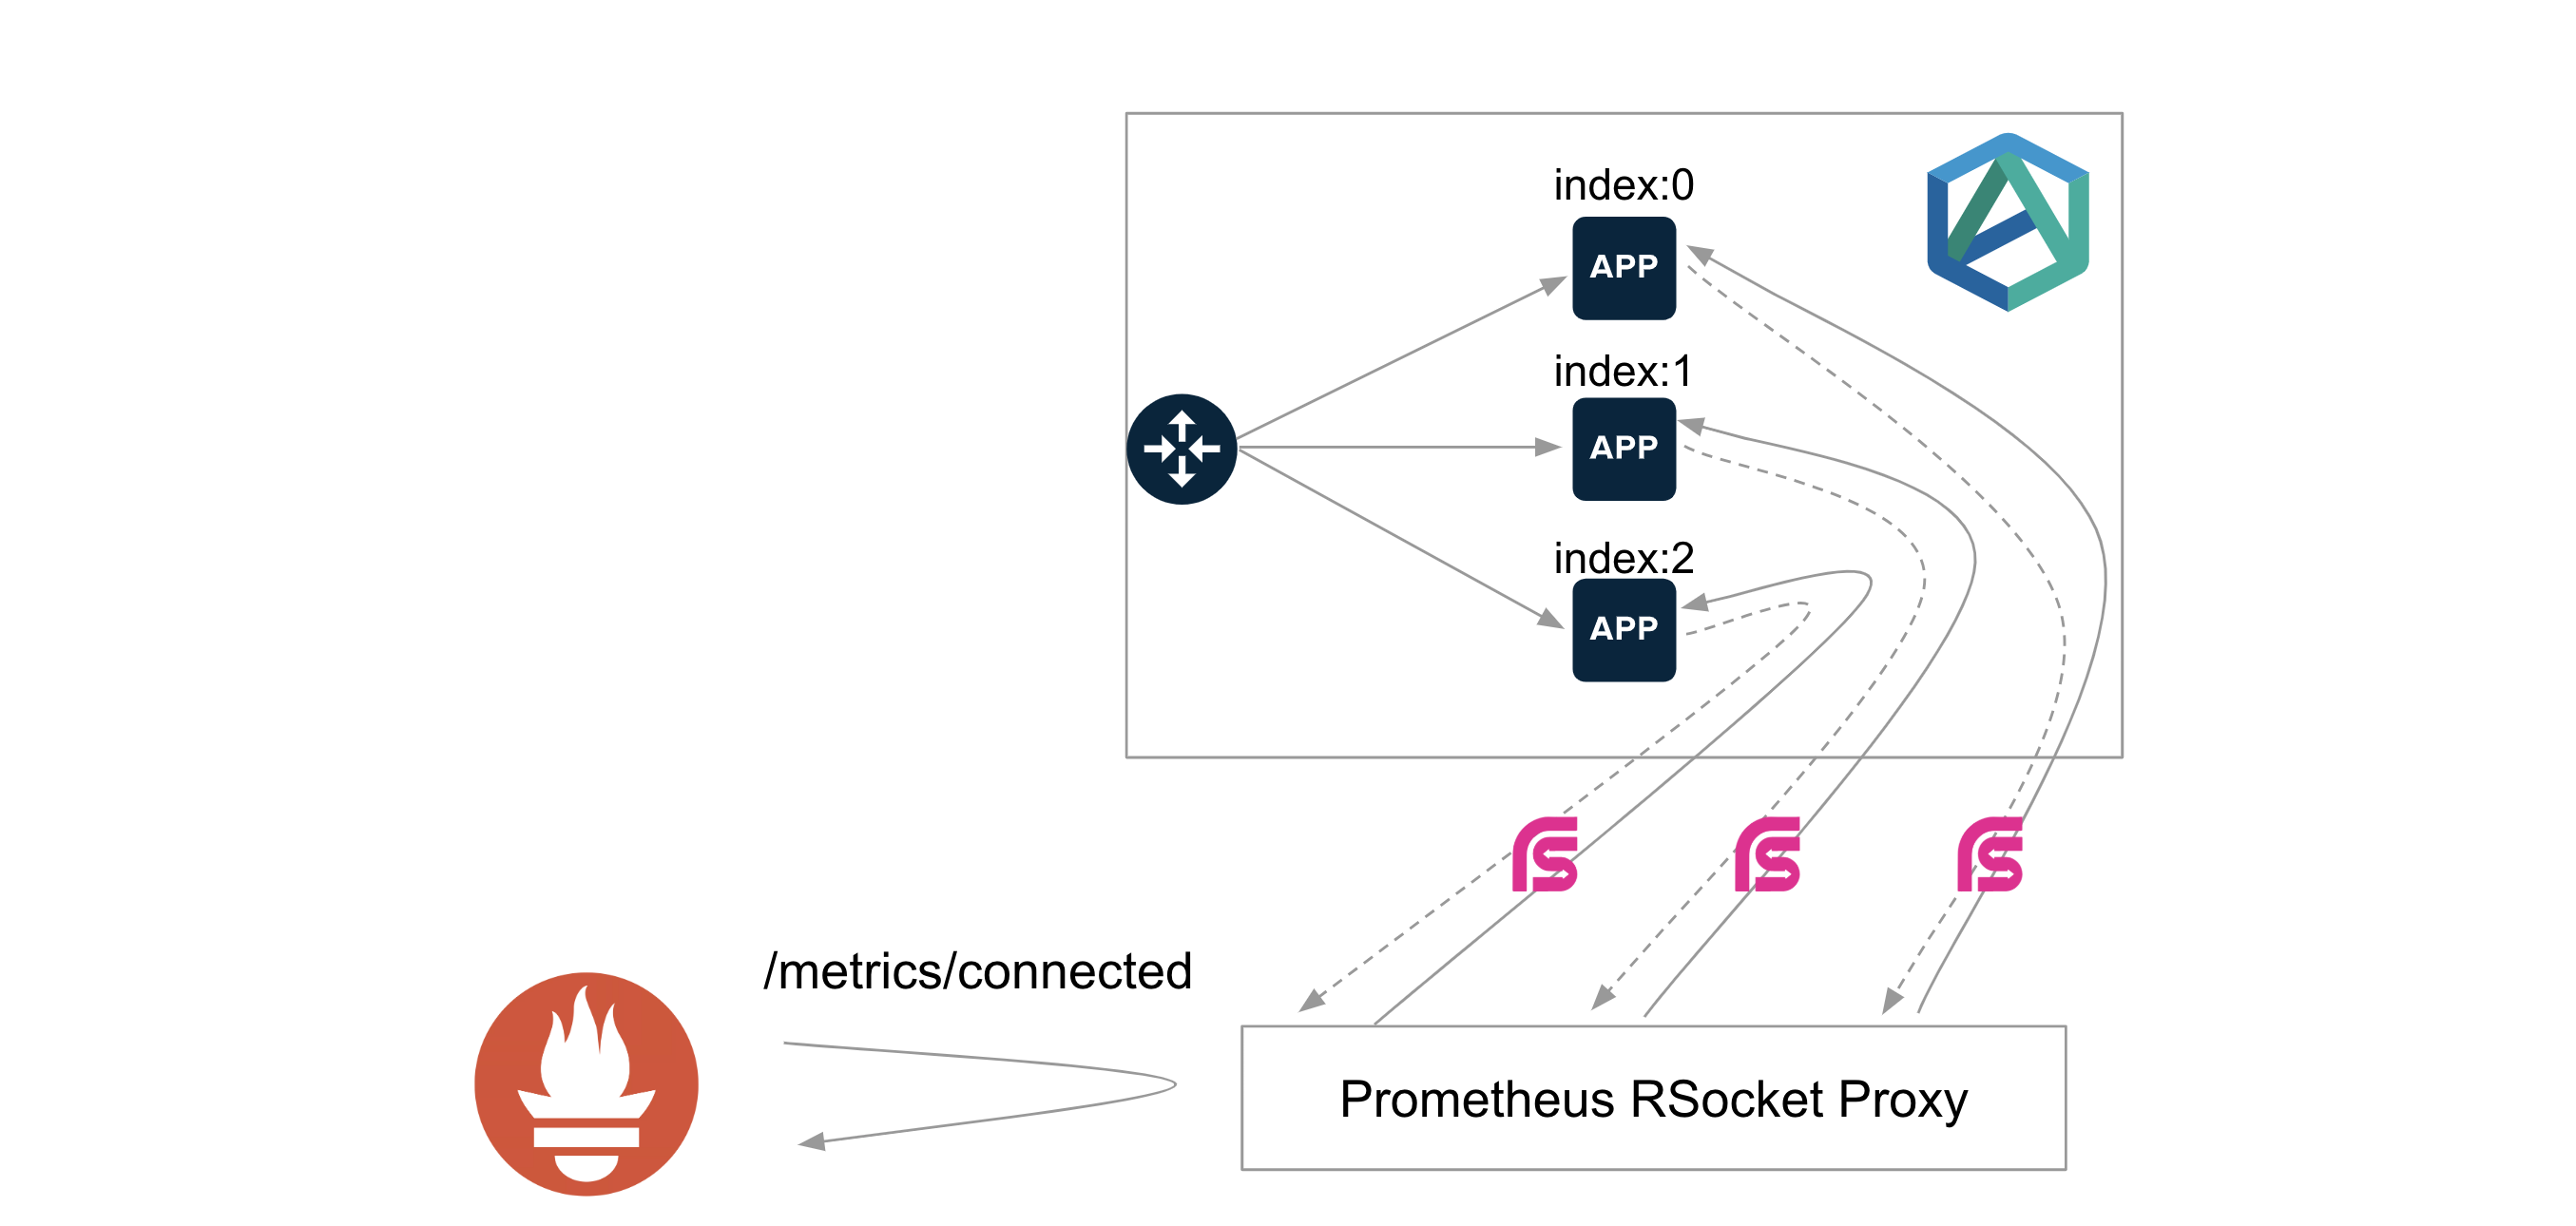
[Micrometer](https://micrometer.io/)の使用が前提なので、Javaアプリに限られます。JavaアプリにPrometheus RSocket Proxyのクライアントライブラリを追加する必要があります。
Spring BootのAutoConfigurationも用意されていますが、Spring Boot 2.1以上が対象です。
PrometheusからPrometheus RSocket ProxyへのアクセスはHTTP(S)ですが、アプリからPrometheus RSocket ProxyへのアクセスははTCPです。
Prometheus RSocket ProxyはTCP Routerを使うことで、`cf push`でデプロイすることも出来ますが、この場合はスケールアウトはできません。
Prometheus RSocket Proxy自体をスケールアウトしたい場合は、VMやKubernetes上に置く必要があります。Kubernetes上にデプロイし、 Horizontal Pod Autoscalerを設定することが推奨されているようです。
Prometheus RSocket Proxyの設定方法は別記事にする予定です。TCP Routerを使ってPAS上にProxyをデプロイする方法は[こちら](https://github.com/making/demo-observability/tree/master/tools/prometheus-rsocket-proxy)にメモしました。
### 解決法の比較
上記の3つは一長一短があります。次の表にまとめます。
| | 👍 | 👎 |
| --- | --- | --- |
| **Promregator** | - 導入が簡単
- アプリで設定が不要
- プログラミング言語に依らない
- Admin権限がなくても設定可能
| - CAPIへ負荷がかかる
- パフォーマンスが悪い
- モニタリング対象追加するにはグループ(Org or Space or App)単位で設定が必要
- グループ単位でScrape対象のパスが同じである必要がある
- モニタリング対象追加の毎に再起動が必要
|
| **Metric Registrar** | - プログラミング言語に依らない
- cf CLIのプラグインでアプリ毎にScrape対象のパスを設定可能
- CF Metric Storeを使えばPrometheus不要
| - CAPIへ負荷がかかる
- Exporterを別途用意する必要がある
- Scrape用のエンドポイントに対するアクセスの認証を設定できない
- PAS 2.4+が必要
- Platformレベルでの設定が必要
|
| **Prometheus RSocket Proxy** | - シンプル
- (多分)パフォーマンスが良い
- Admin権限がなくても設定可能
| - Javaのみ利用可能
- クライアントライブラリが必要(Spring Boot 2.1+)
- アプリを区別するためのメタデータラベルの追加が必要
|
Platoformレベルでメトリクスを収集したい場合は、まずはMetric Registrar + Reliability View Exporter for PASを試して見ると良いと思います。新しいバージョンのSpring Bootを使うケースがほとんどの場合はPrometheus RSocket Proxyがフィットするかもしれません。
Platformレベルではサポートされず、Developerレベルでメトリクスを収集したい場合は、PromregatorまたはPrometheus RSocket Proxyを試して見ると良いと思います。
### Micrometer用Grafanaダッシュボードサンプル
上記の方法でMicometerのメトリクスをScrapeしている場合は↓のGrafanaダッシュボードを利用できます。
https://github.com/making/demo-micrometer/raw/master/grafana/micrometer-summary-cf.json

このダッシュボードは次のラベルが設定されていることを前提に作成されています。
* `org_name`
* `space_name`
* `app_name`
* `cf_instance_id`
* `cf_instance_number`
が設定されていることが
Promregatorが付与するラベルと互換なので、Promregatorを使っている場合は設定が不要です。
それ以外でSpring Bootを使っている場合は`application.properties`に次の値を設定すれば良いです。
```properties
management.metrics.tags.org_name=${cloud.application.organization_name:demo}
management.metrics.tags.space_name=${cloud.application.space_name:demo}
management.metrics.tags.app_name=${cloud.application.application_name:demo}
management.metrics.tags.cf_instance_id=${cloud.application.application_id:demo}:${cloud.application.instance_index:0}
management.metrics.tags.cf_instance_number=${cloud.application.instance_index:0}
```
> Java Buildpack 4.21で共通タグが設定されるようになるので、将来的に上記のタグ設定は不要になるでしょう。
>
> https://github.com/cloudfoundry/java-buildpack/issues/644