Kubernetesハンズオン - 1. Hello Kubernetes
kubectlコマンドを使って、まずはアプリケーションをデプロイしてみます。
新出用語は無視して下さい。
以下の実行結果例はPKS 1.5.0-build.30 on vSphere (without NSX-T)の場合です。
PKSを使用している場合は、次のコマンドで~/.kube/configをアップデートしてください。
pks get-credentials <cluster_name> --sso-auto
または
pks get-kubeconfig -a <PKS API> <cluster_name> -k --sso-auto
次のバージョンで動作確認しています。
$ kubectl version
Client Version: version.Info{Major:"1", Minor:"14", GitVersion:"v1.14.0", GitCommit:"641856db18352033a0d96dbc99153fa3b27298e5", GitTreeState:"clean", BuildDate:"2019-03-26T00:05:06Z", GoVersion:"go1.12.1", Compiler:"gc", Platform:"darwin/amd64"}
Server Version: version.Info{Major:"1", Minor:"14", GitVersion:"v1.14.5", GitCommit:"0e9fcb426b100a2aea5ed5c25b3d8cfbb01a8acf", GitTreeState:"clean", BuildDate:"2019-08-05T09:13:08Z", GoVersion:"go1.12.5", Compiler:"gc", Platform:"linux/amd64"}
目次
Kubernetesクラスタの確認
まずは利用しているKubernetesの環境を確認します。
kubectl cluster-infoでクラスタ情報を表示します。
kubectl cluster-info
出力結果(PKS)
$ kubectl cluster-info
Kubernetes master is running at https://maki.k8s.pivotal.bosh.tokyo:8443
CoreDNS is running at https://maki.k8s.pivotal.bosh.tokyo:8443/api/v1/namespaces/kube-system/services/kube-dns:dns/proxy

To further debug and diagnose cluster problems, use 'kubectl cluster-info dump'.
kubectl get nodeでWorkerノード情報の表示します。-o wideをつけると詳細表示になります。
kubectl get node -o wide
出力結果(PKS)
NAME                                   STATUS   ROLES    AGE   VERSION   INTERNAL-IP    EXTERNAL-IP    OS-IMAGE             KERNEL-VERSION      CONTAINER-RUNTIME
10b533d1-075d-4ecc-83c7-0e4eba4da357   Ready    <none>   40h   v1.14.5   192.168.3.16   192.168.3.16   Ubuntu 16.04.6 LTS   4.15.0-55-generic   docker://18.9.8
82cc53c4-e825-4f82-af32-572321c0bf2f   Ready    <none>   40h   v1.14.5   192.168.3.15   192.168.3.15   Ubuntu 16.04.6 LTS   4.15.0-55-generic   docker://18.9.8
fa01f449-8004-43a2-957d-c8edc11de11b   Ready    <none>   40h   v1.14.5   192.168.3.14   192.168.3.14   Ubuntu 16.04.6 LTS   4.15.0-55-generic   docker://18.9.8
kubectl config current-contextで現在のコンテキストの表示します。
kubectl config current-context
出力結果(PKS)
<cluster_name>
kubectl get all --all-namespacesで全名前空間のリソースを表示します。
kubectl get all --all-namespaces
出力結果(PKS)
NAMESPACE     NAME                                                                READY   STATUS      RESTARTS   AGE
kube-system   pod/coredns-95489c5c9-2frwc                                         1/1     Running     0          41h
kube-system   pod/coredns-95489c5c9-5tr8w                                         1/1     Running     0          41h
kube-system   pod/coredns-95489c5c9-7p5jn                                         1/1     Running     0          41h
kube-system   pod/kubernetes-dashboard-558689fc66-rp4t8                           1/1     Running     0          41h
kube-system   pod/metrics-server-867b8fdb7d-tjhk7                                 1/1     Running     0          41h
pks-system    pod/cert-generator-dea87263fc8e6d3a2a122f5f5e31b36afbeef369-grb4f   0/1     Completed   0          41h
pks-system    pod/event-controller-646d78b9b8-dmggx                               2/2     Running     0          41h
pks-system    pod/fluent-bit-d9nlx                                                2/2     Running     0          41h
pks-system    pod/fluent-bit-pqm87                                                2/2     Running     0          41h
pks-system    pod/fluent-bit-qxcgs                                                2/2     Running     0          41h
pks-system    pod/metric-controller-c998cb5bf-cmmqh                               1/1     Running     0          41h
pks-system    pod/observability-manager-64f749cd4c-5fv9l                          1/1     Running     0          41h
pks-system    pod/sink-controller-6774fd95f7-fppd4                                1/1     Running     0          41h
pks-system    pod/telegraf-4n7qz                                                  1/1     Running     0          41h
pks-system    pod/telegraf-b84hc                                                  1/1     Running     0          41h
pks-system    pod/telegraf-fpmdq                                                  1/1     Running     0          41h
pks-system    pod/telemetry-agent-858446f4ff-6727s                                2/2     Running     0          40h
pks-system    pod/validator-6b677f49d4-tjs72                                      1/1     Running     0          41h
pks-system    pod/vrops-cadvisor-5r77l                                            1/1     Running     0          41h
pks-system    pod/vrops-cadvisor-99qrp                                            1/1     Running     0          41h
pks-system    pod/vrops-cadvisor-9bk6g                                            1/1     Running     0          41h

NAMESPACE     NAME                           TYPE        CLUSTER-IP       EXTERNAL-IP   PORT(S)         AGE
default       service/kubernetes             ClusterIP   10.100.200.1     <none>        443/TCP         41h
kube-system   service/kube-dns               ClusterIP   10.100.200.2     <none>        53/UDP,53/TCP   41h
kube-system   service/kubernetes-dashboard   NodePort    10.100.200.177   <none>        443:30709/TCP   41h
kube-system   service/metrics-server         ClusterIP   10.100.200.207   <none>        443/TCP         41h
pks-system    service/fluent-bit             ClusterIP   10.100.200.219   <none>        24224/TCP       41h
pks-system    service/validator              ClusterIP   10.100.200.187   <none>        443/TCP         41h

NAMESPACE    NAME                            DESIRED   CURRENT   READY   UP-TO-DATE   AVAILABLE   NODE SELECTOR   AGE
pks-system   daemonset.apps/fluent-bit       3         3         3       3            3           <none>          41h
pks-system   daemonset.apps/telegraf         3         3         3       3            3           <none>          41h
pks-system   daemonset.apps/vrops-cadvisor   3         3         3       3            3           <none>          41h

NAMESPACE     NAME                                    READY   UP-TO-DATE   AVAILABLE   AGE
kube-system   deployment.apps/coredns                 3/3     3            3           41h
kube-system   deployment.apps/kubernetes-dashboard    1/1     1            1           41h
kube-system   deployment.apps/metrics-server          1/1     1            1           41h
pks-system    deployment.apps/event-controller        1/1     1            1           41h
pks-system    deployment.apps/metric-controller       1/1     1            1           41h
pks-system    deployment.apps/observability-manager   1/1     1            1           41h
pks-system    deployment.apps/sink-controller         1/1     1            1           41h
pks-system    deployment.apps/telemetry-agent         1/1     1            1           40h
pks-system    deployment.apps/validator               1/1     1            1           41h

NAMESPACE     NAME                                               DESIRED   CURRENT   READY   AGE
kube-system   replicaset.apps/coredns-95489c5c9                  3         3         3       41h
kube-system   replicaset.apps/kubernetes-dashboard-558689fc66    1         1         1       41h
kube-system   replicaset.apps/metrics-server-867b8fdb7d          1         1         1       41h
pks-system    replicaset.apps/event-controller-646d78b9b8        1         1         1       41h
pks-system    replicaset.apps/metric-controller-c998cb5bf        1         1         1       41h
pks-system    replicaset.apps/observability-manager-64f749cd4c   1         1         1       41h
pks-system    replicaset.apps/sink-controller-6774fd95f7         1         1         1       41h
pks-system    replicaset.apps/telemetry-agent-858446f4ff         1         1         1       40h
pks-system    replicaset.apps/validator-6b677f49d4               1         1         1       41h

NAMESPACE    NAME                                                                COMPLETIONS   DURATION   AGE
pks-system   job.batch/cert-generator-dea87263fc8e6d3a2a122f5f5e31b36afbeef369   1/1           21s        41h
サンプルアプリケーションのデプロイ
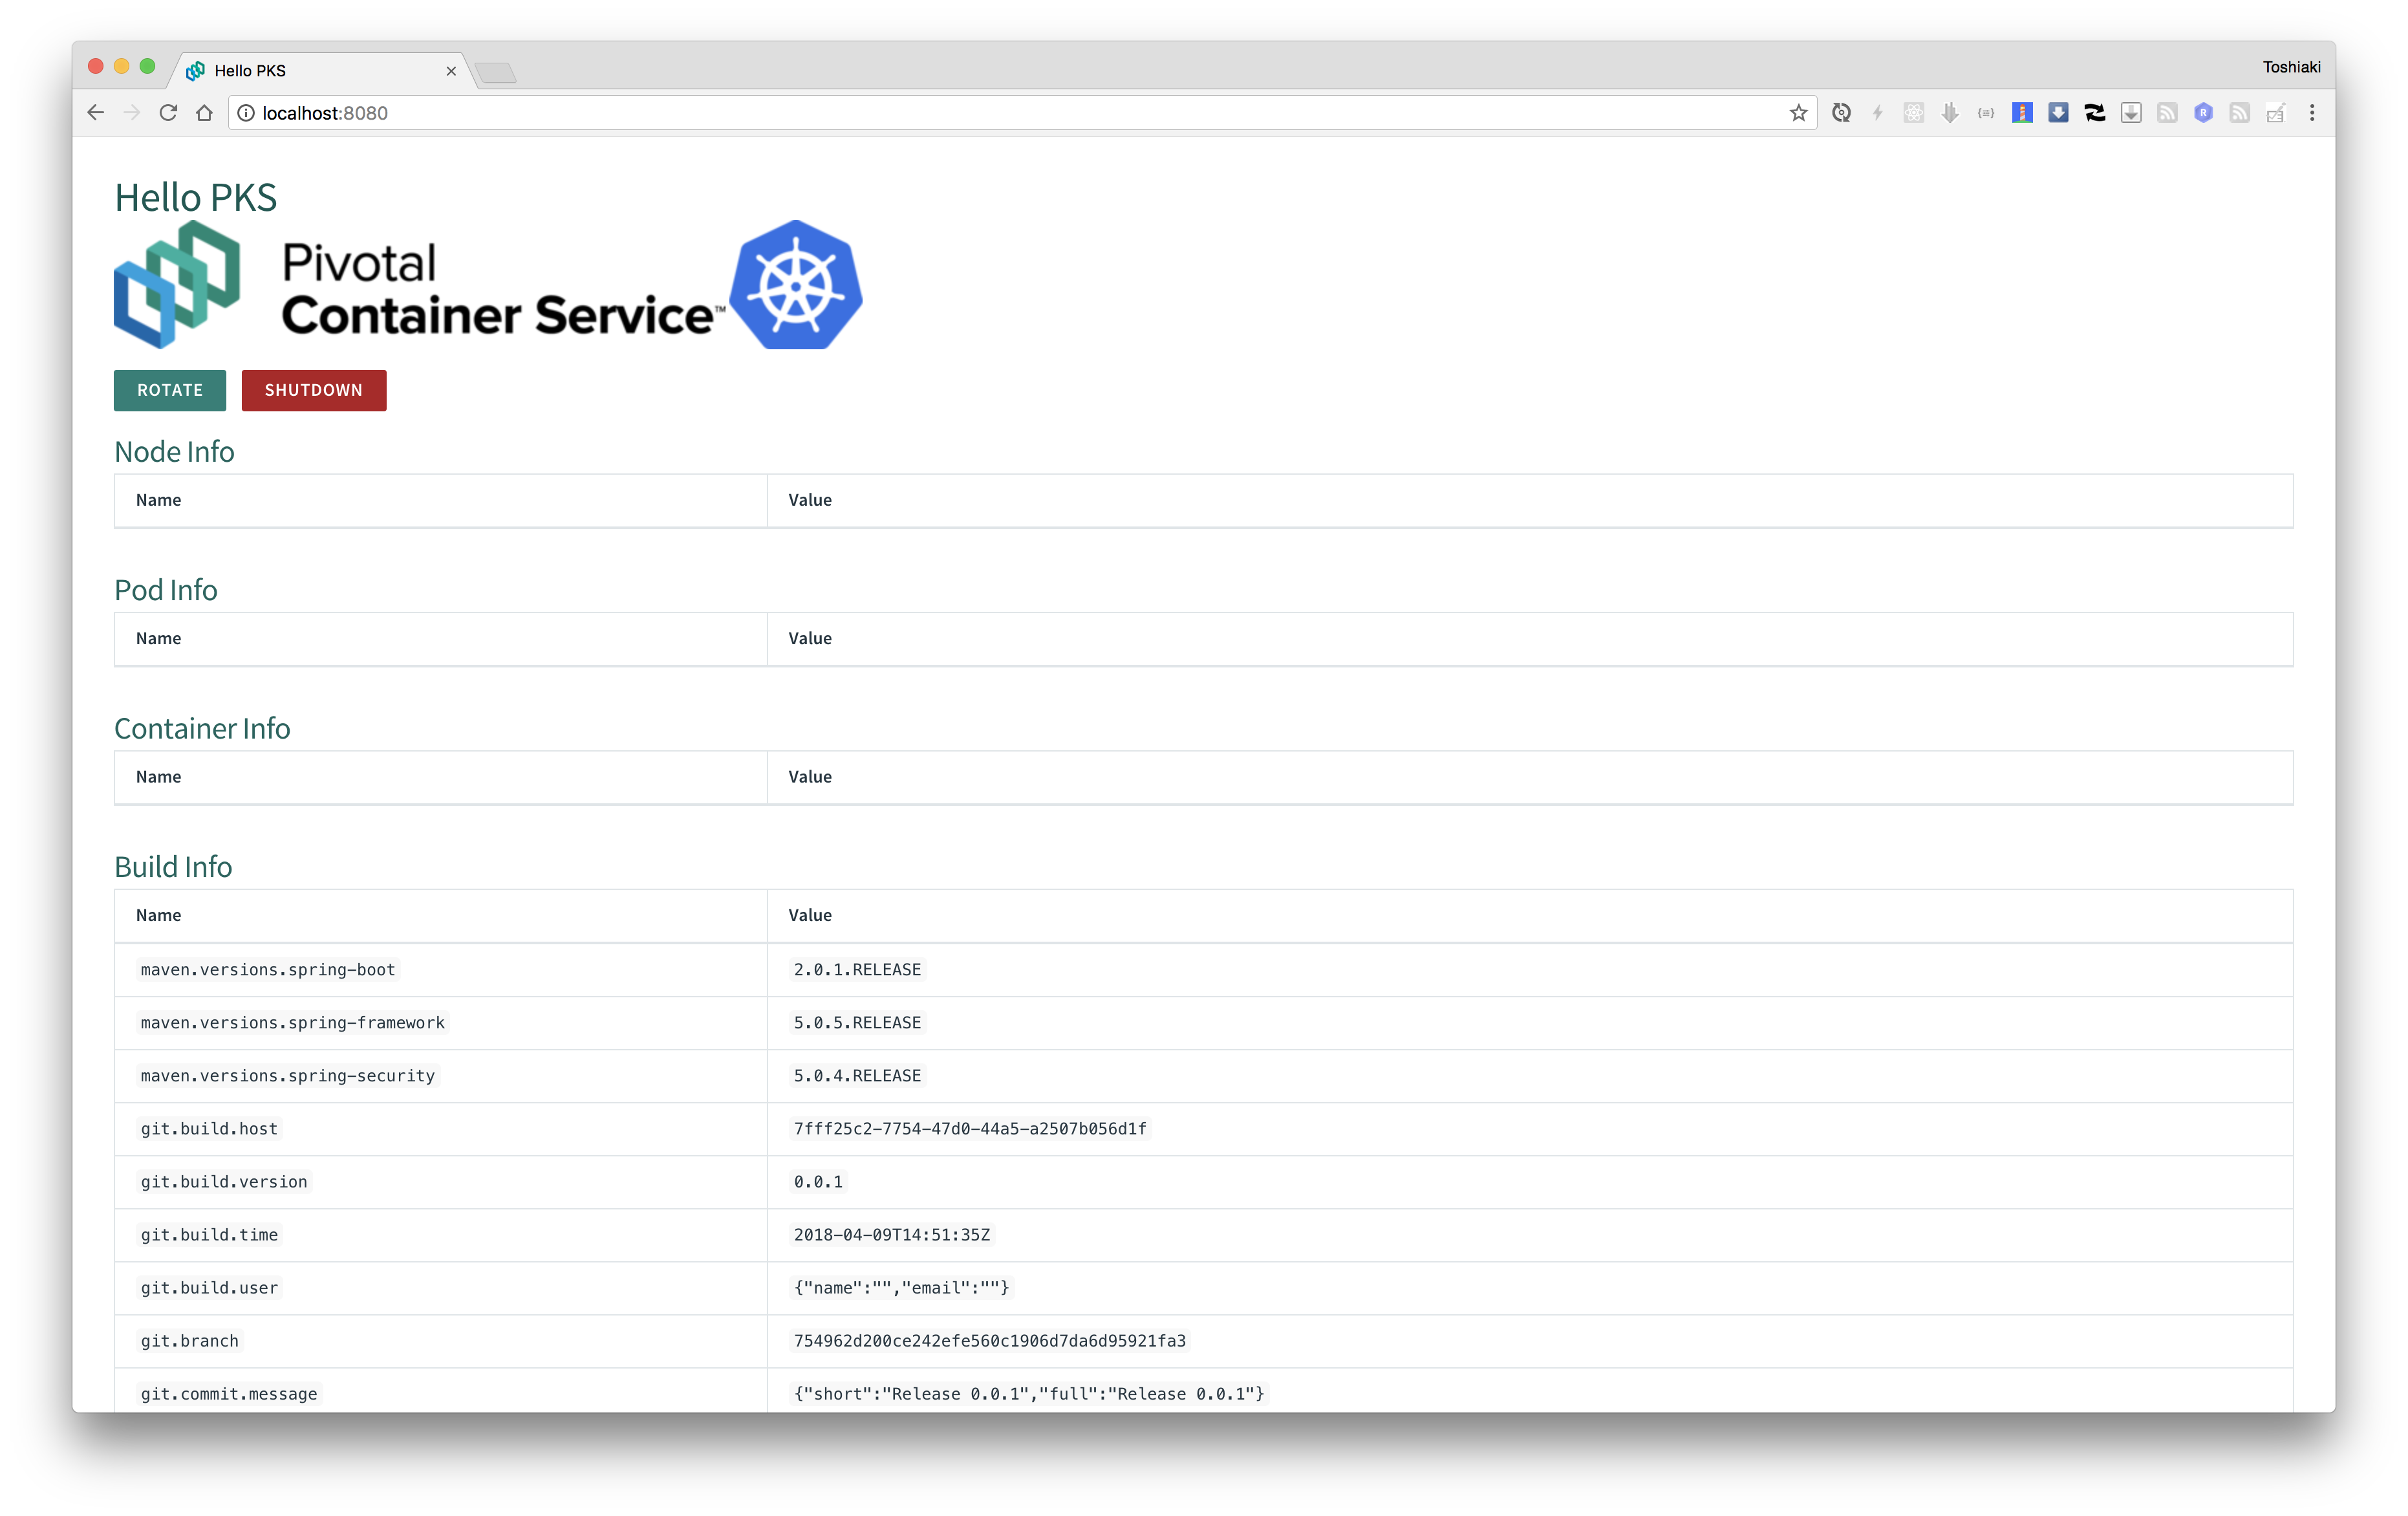
サンプルアプリケーションmaking/hello-pksをデプロイします。
kubectl run <デプロイ名> --image=<Dockerイメージ名> --generator=run-pod/v1 --port=<コンテナが公開するポート>
kubectl run hello-pks --image=making/hello-pks:0.0.1 --generator=run-pod/v1 --port=8080
出力結果
pod/hello-pks created
kubectl get allで作成されたリソースを表示します。
kubectl get all
出力結果(PKS)
NAME            READY   STATUS              RESTARTS   AGE
pod/hello-pks   0/1     ContainerCreating   0          10s

NAME                 TYPE        CLUSTER-IP     EXTERNAL-IP   PORT(S)   AGE
service/kubernetes   ClusterIP   10.100.200.1   <none>        443/TCP   42h
初回はDockerイメージのフェッチが完了していないため、起動まで時間がかかります。pod/hello-pksのSTATUSがContainerCreatingになっているでしょう。
しばらくして再度kubectl get allを実行するとSTATUSがRunningになります。
kubectl get all
出力結果
NAME            READY   STATUS    RESTARTS   AGE
pod/hello-pks   1/1     Running   0          48s

NAME                 TYPE        CLUSTER-IP     EXTERNAL-IP   PORT(S)   AGE
service/kubernetes   ClusterIP   10.100.200.1   <none>        443/TCP   42h
このアプリケーション(コンテナ)はポート8080で起動します。ポートフォワードの設定を行い、このアプリケーションにlocalhostでアクセスします。
kubectl port-forward <Pod名> <ローカルポート>:<リモートポート>を実行してください。
kubectl port-forward hello-pks 8080:8080
出力結果
Forwarding from 127.0.0.1:8080 -> 8080
http://localhost:8080にアクセスして下さい。
次にターミナルからhttp://localhost:8080/actuator/healthにアクセスして下さい。
curl http://localhost:8080/actuator/health
出力結果
{
  "status" : "UP"
}
Kubenetes Dashboardへのアクセス
次にDashboardにアクセスします。
環境(Docker for Macなど)によってはDashboardがインストールされていないため、kubectl get deployment -n kube-systemでkube-system名前空間のDeployment一覧を確認して下さい。
kubectl get deployment -n kube-system
出力結果(PKS)
NAME                   READY   UP-TO-DATE   AVAILABLE   AGE
coredns                3/3     3            3           42h
kubernetes-dashboard   1/1     1            1           42h
metrics-server         1/1     1            1           42h
kubectl get pod -n kube-systemでkube-system名前空間のPod一覧を確認し、kubernetes-dashboardのPodのSTATUSがRunningになっていることを確認して下さい。
kubectl get pod -n kube-system
出力結果(PKS)
NAME                                    READY   STATUS    RESTARTS   AGE
coredns-95489c5c9-2frwc                 1/1     Running   0          42h
coredns-95489c5c9-5tr8w                 1/1     Running   0          42h
coredns-95489c5c9-7p5jn                 1/1     Running   0          42h
kubernetes-dashboard-558689fc66-rp4t8   1/1     Running   0          42h
metrics-server-867b8fdb7d-tjhk7         1/1     Running   0          42h
kubectl proxyを実行すると、http://127.0.0.1:8001/api/v1/namespaces/kube-system/services/https:kubernetes-dashboard:/proxy/でDashboardへポートフォワードされます。
ショートカットとしてhttp://bit.ly/k8s-dashboardを利用できます。
kubectl proxy
出力結果
Starting to serve on 127.0.0.1:8001
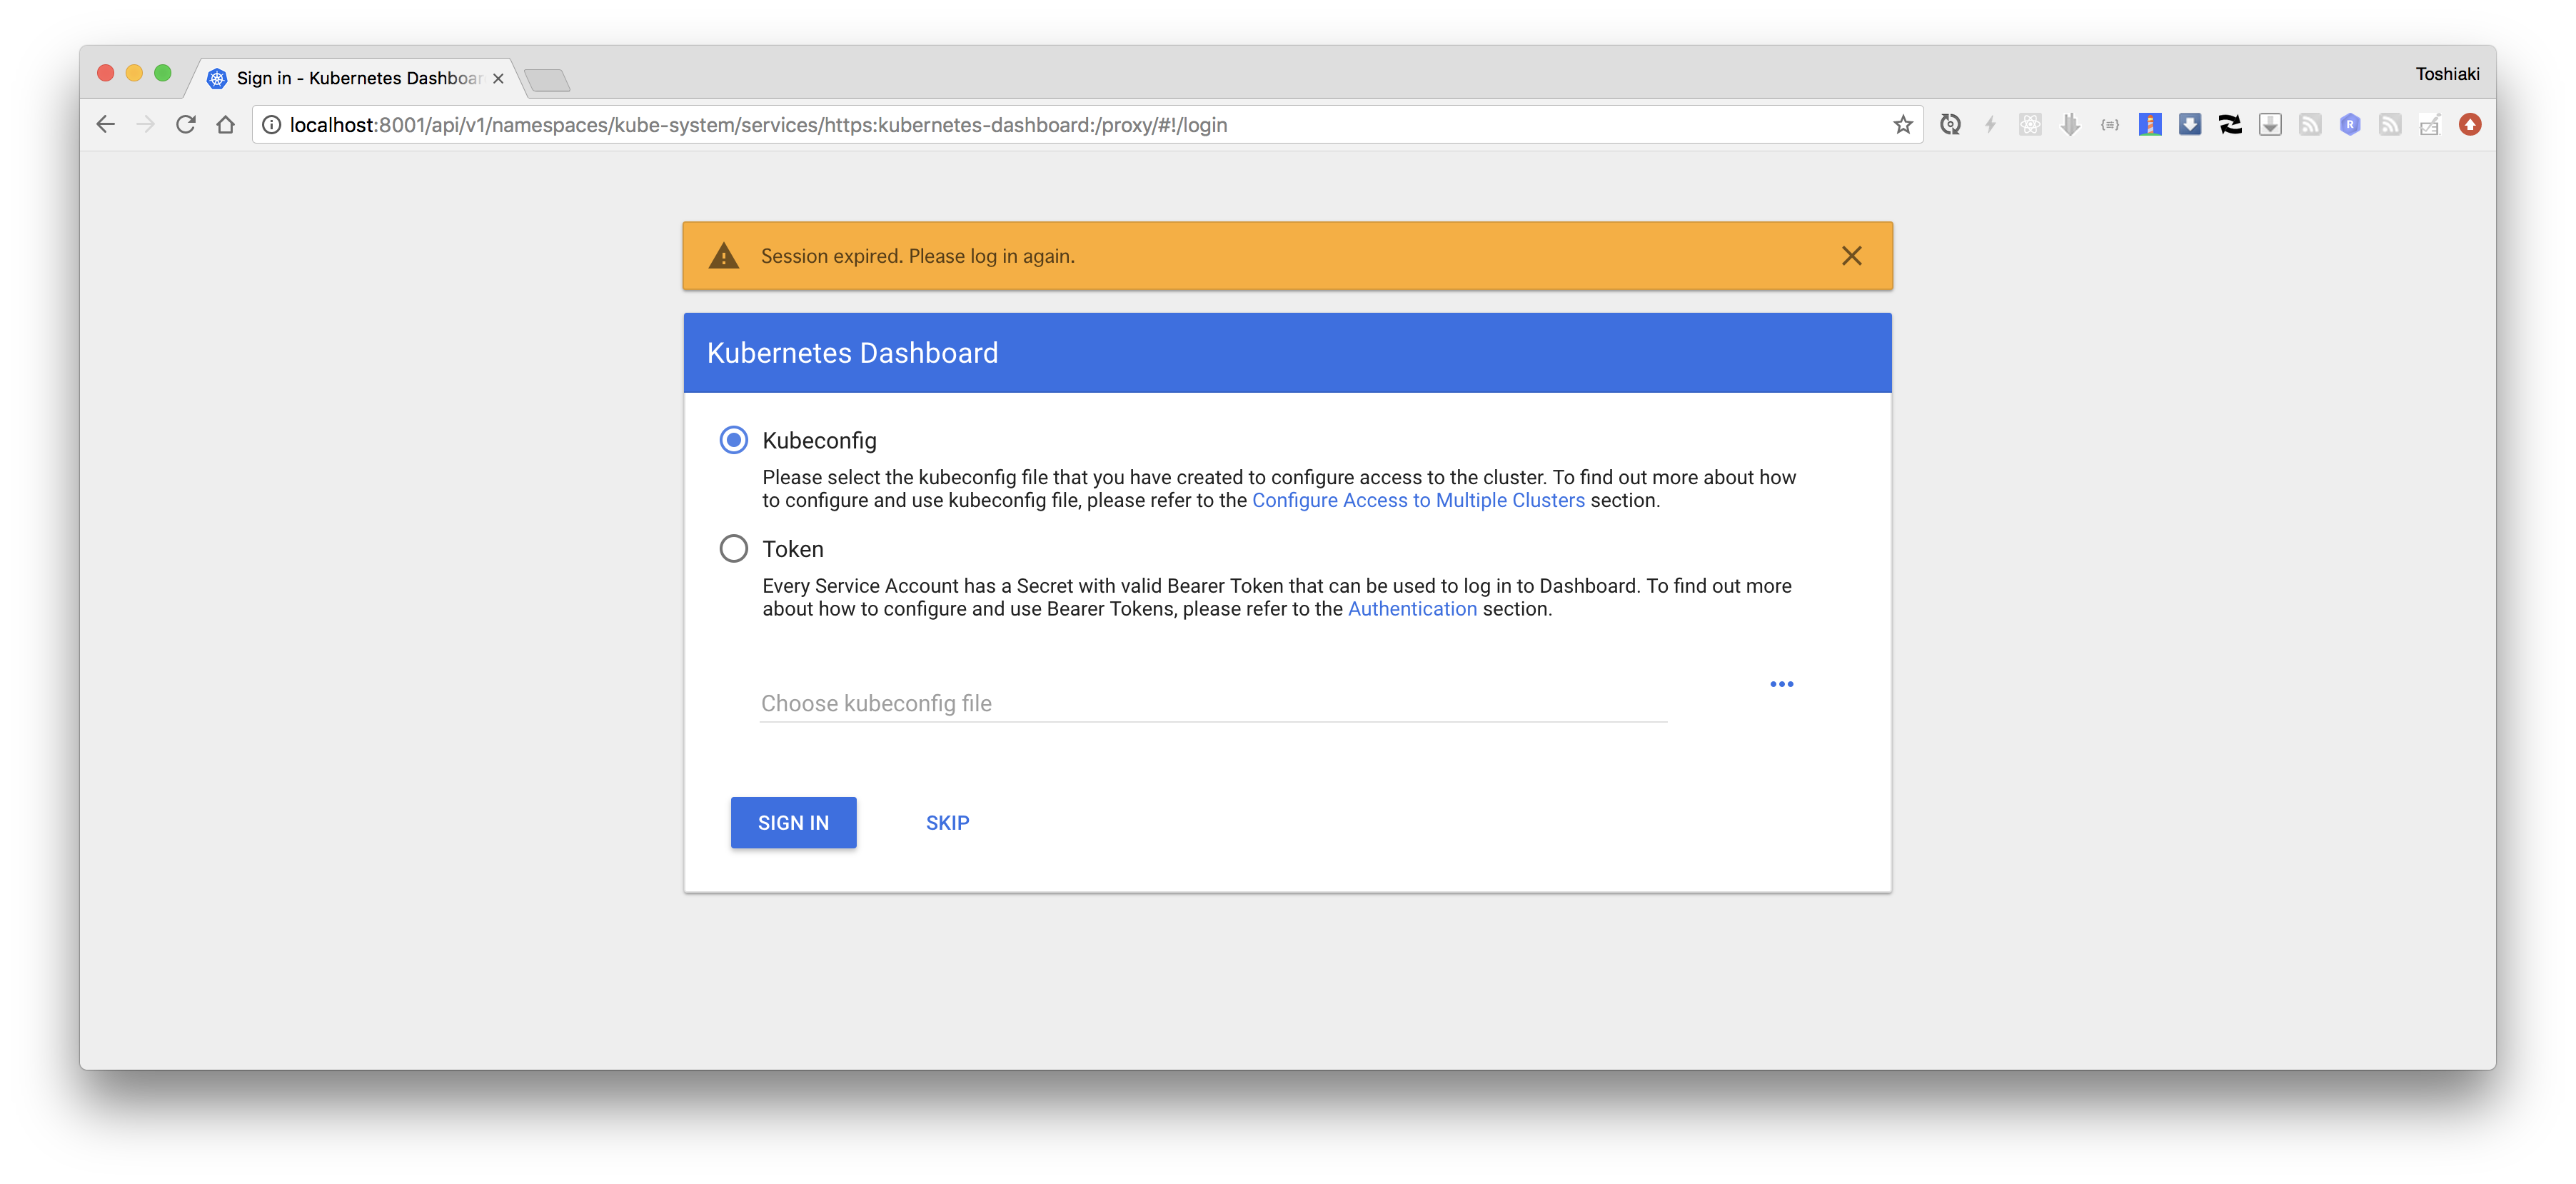
"Token"を選択し、次のコマンドの出力結果を入力してサインインしてください。
kubectl -n kube-system get secrets $(kubectl -n kube-system get serviceaccount clusterrole-aggregation-controller -o jsonpath="{.secrets[0].name}") -o go-template="{{.data.token | base64decode}}"
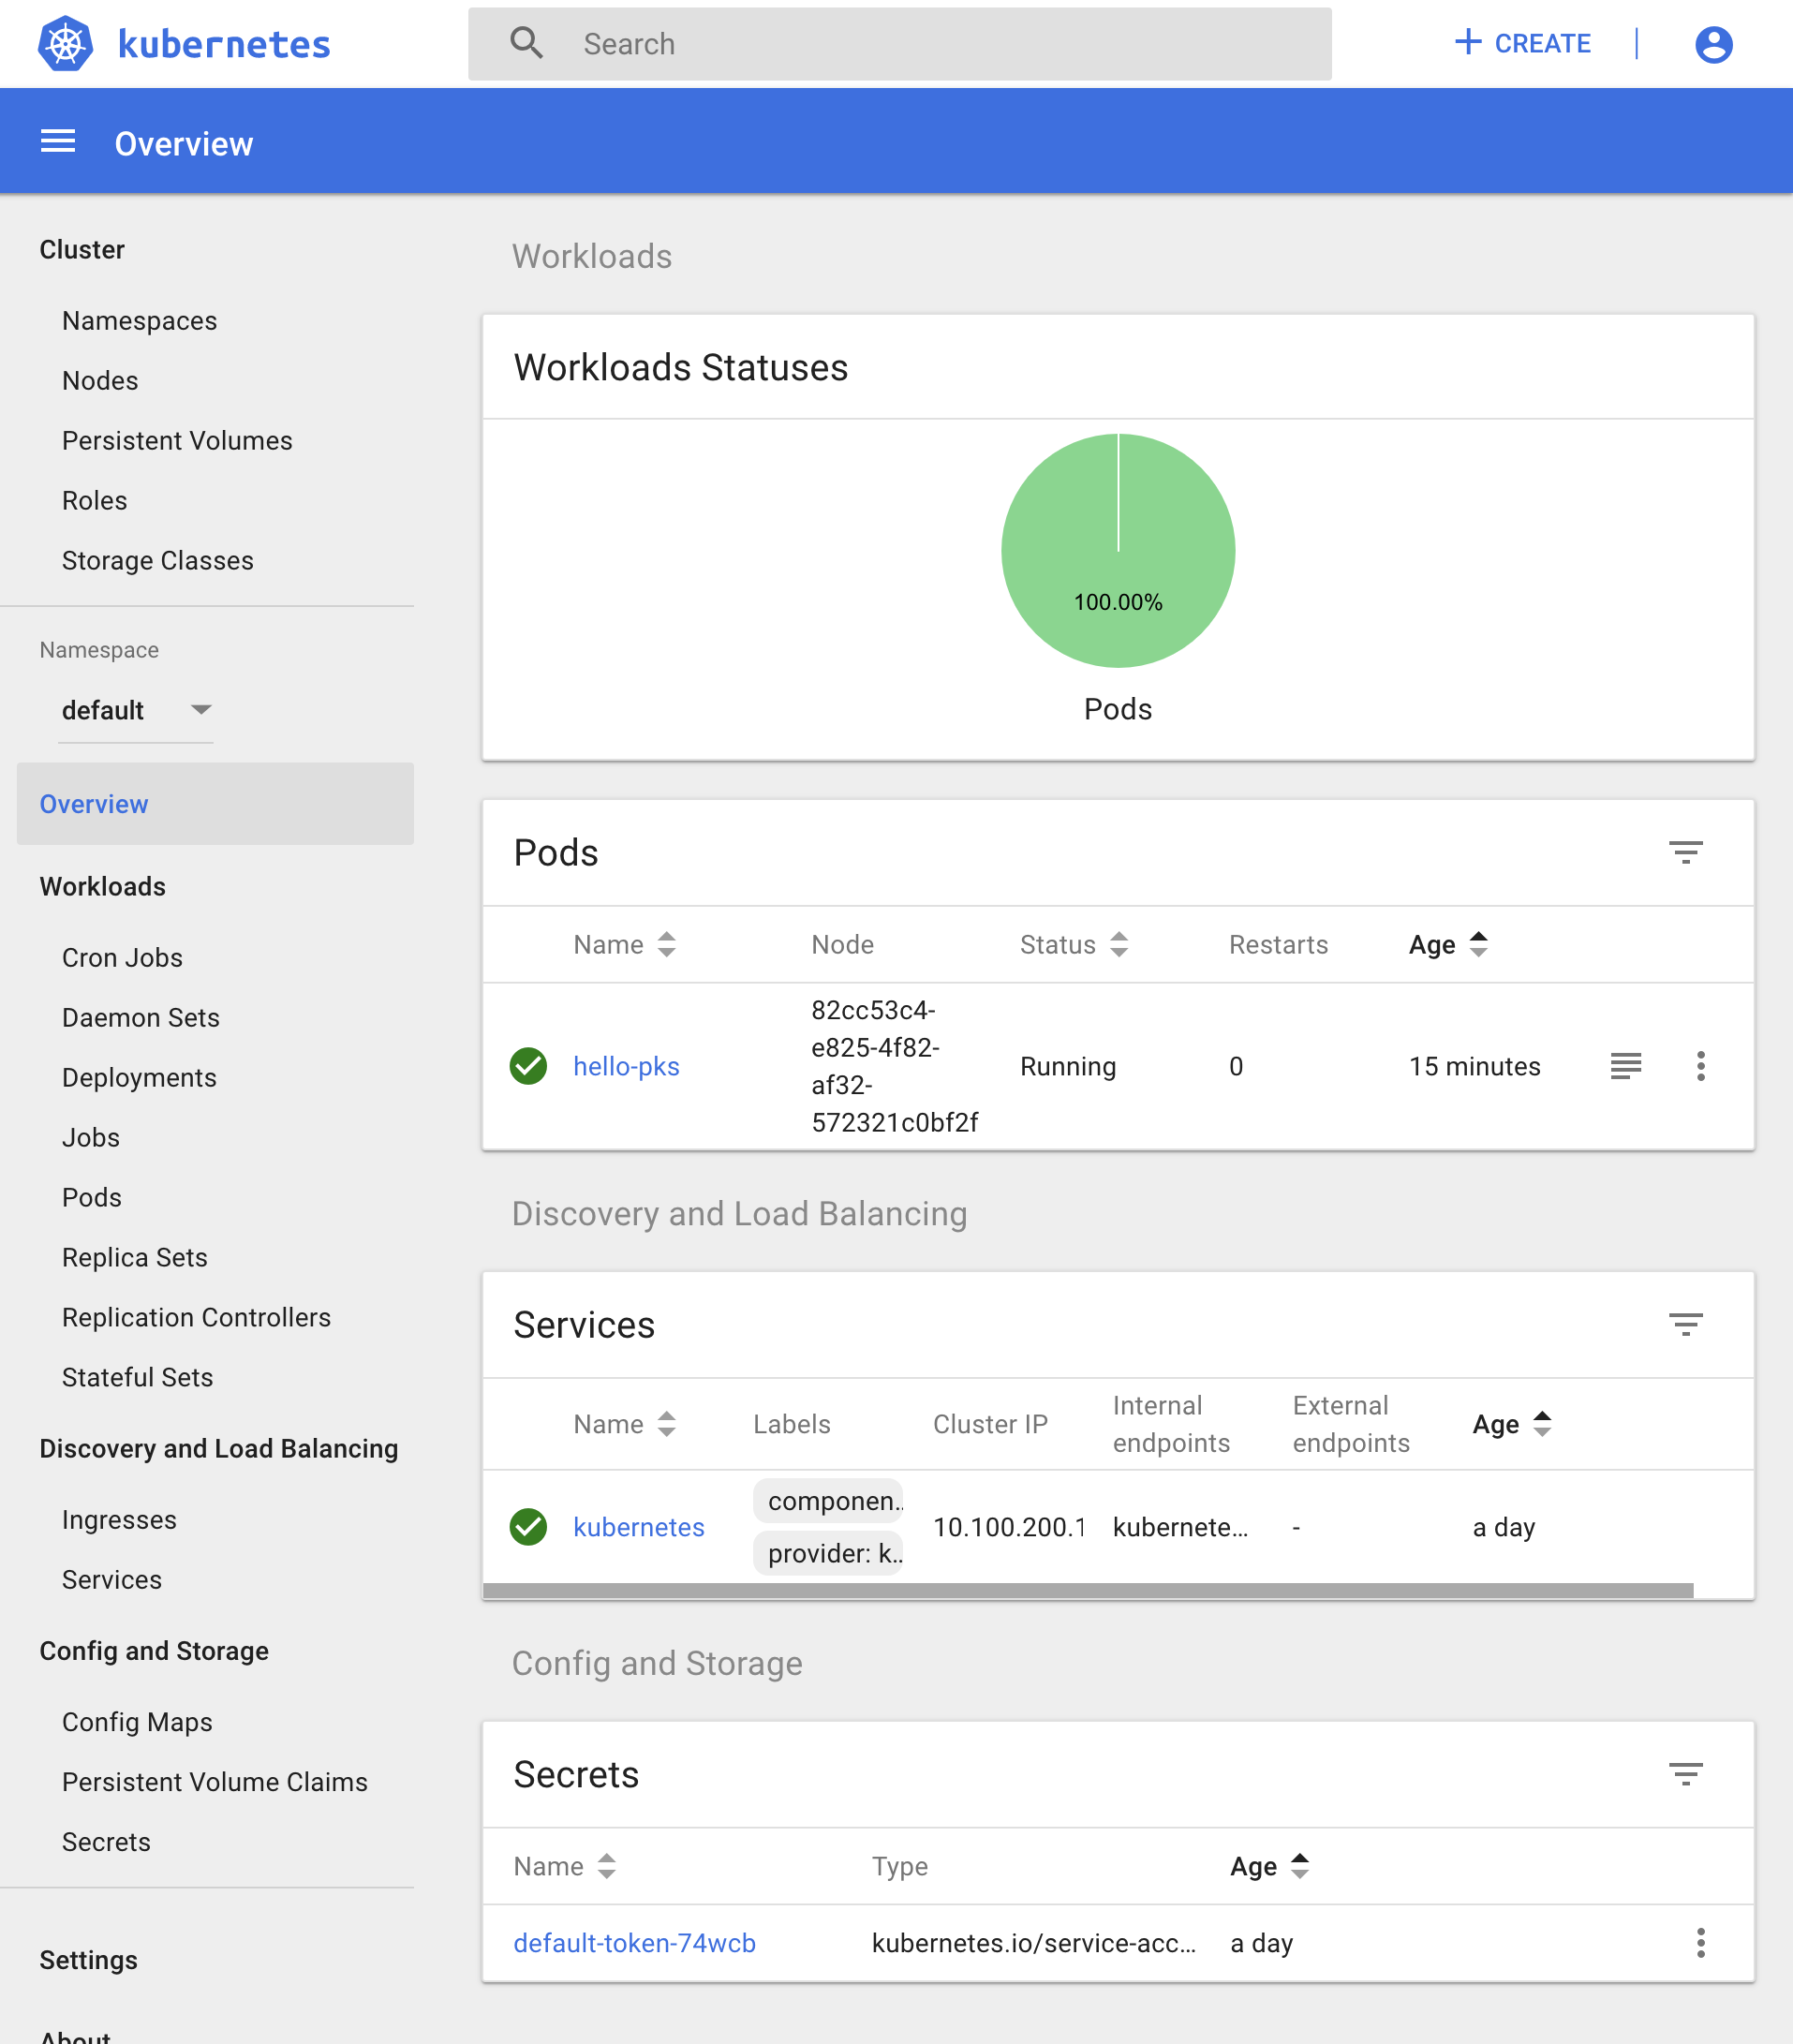
Dashboardにサインインできたら、左のメニューから"Namespace"を変更し、"Deployments"、"Pods"、"Services"などを選択し、リソースが存在することを確認して下さい。
アプリケーションの削除
一旦アプリケーションを削除します。
kubectl delete pod hello-pks
出力結果
pod "hello-pks" deleted